System Health and Potential Problems
The System Health tools help you notice operational problems before they turn into lost traffic, broken tracking, or unavailable campaign pages.
Use this article when the alert bell shows a warning, when campaign routing looks unusual, or when you want to check whether the tracker server is healthy.
How the Health Tools Work Together
Bangi has three main places for checking problems:
| Tool | What it shows | When to use it |
|---|---|---|
Alerts |
A short list of active problems that need attention | Start here when the bell icon is highlighted |
Health |
Server, certificate, and Nginx diagnostics | Use it for infrastructure and domain problems |
Discards |
Traffic that reached a campaign but did not match any flow | Use it for campaign routing and rule problems |
Think of Alerts as the smoke alarm. It tells you that something needs attention. Health and Discards are the inspection tools that help you understand where the smoke is coming from.
Check Alerts
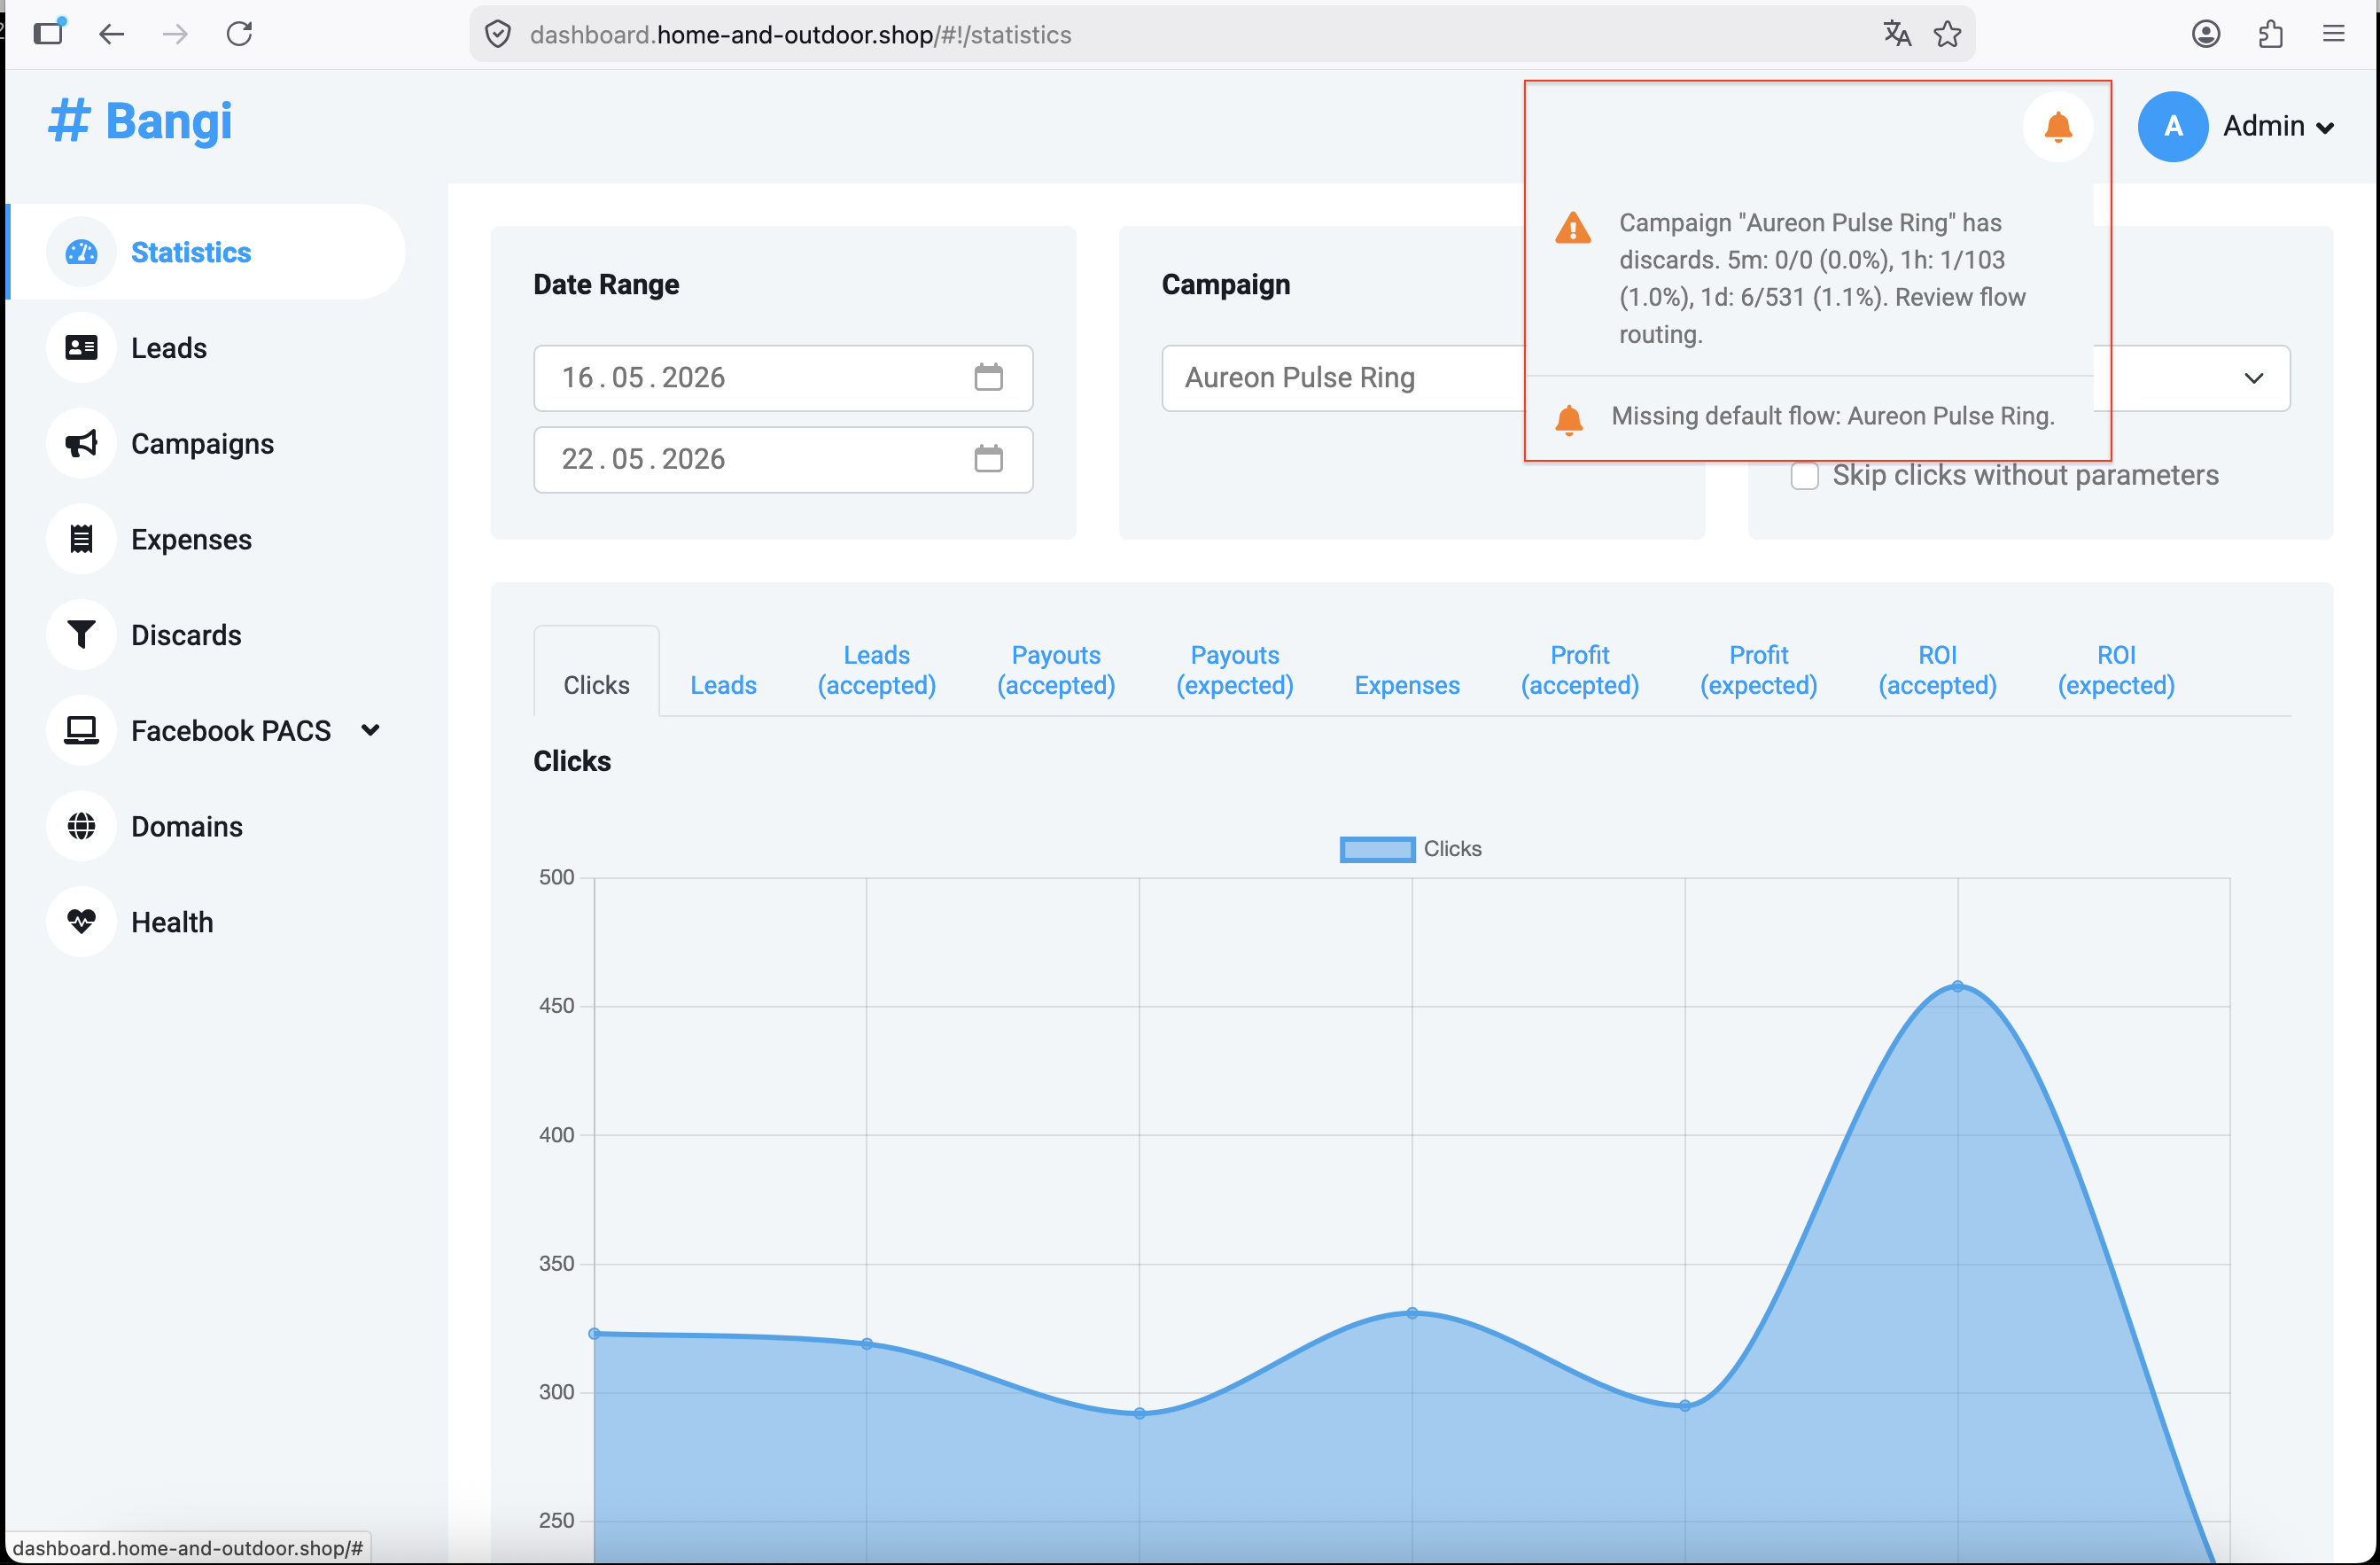
The alert bell is in the dashboard header. When there are active alerts, the bell changes color based on the most serious problem:
| Severity | Meaning | Recommended response |
|---|---|---|
Info |
Something is unusual, but it may not be urgent | Review when convenient |
Warning |
A problem may soon affect traffic, tracking, or operations | Investigate soon |
Error |
A problem is already serious or may break important behavior | Investigate immediately |
Open the bell dropdown to read each alert message. The message usually tells you which system area is affected and what to review next.
The dashboard checks alerts automatically about once every 10 minutes. After you fix a problem, the alert may stay visible until the next refresh. If you need to confirm immediately, refresh the dashboard page manually.
Common alert groups:
| Alert group | What it usually means | Where to investigate |
|---|---|---|
| Disk or stale telemetry | The server storage is high, critical, or no recent disk report was received | Health |
| Certificate | A domain certificate is expired, close to expiry, or failing to issue or renew | Health and Domains |
| Nginx validation | The latest Nginx configuration validation failed | Health |
| Campaign discards | A campaign received traffic that did not match a flow | Discards and campaign flow settings |
Check System Health in Health
Go to Health from the dashboard sidebar.
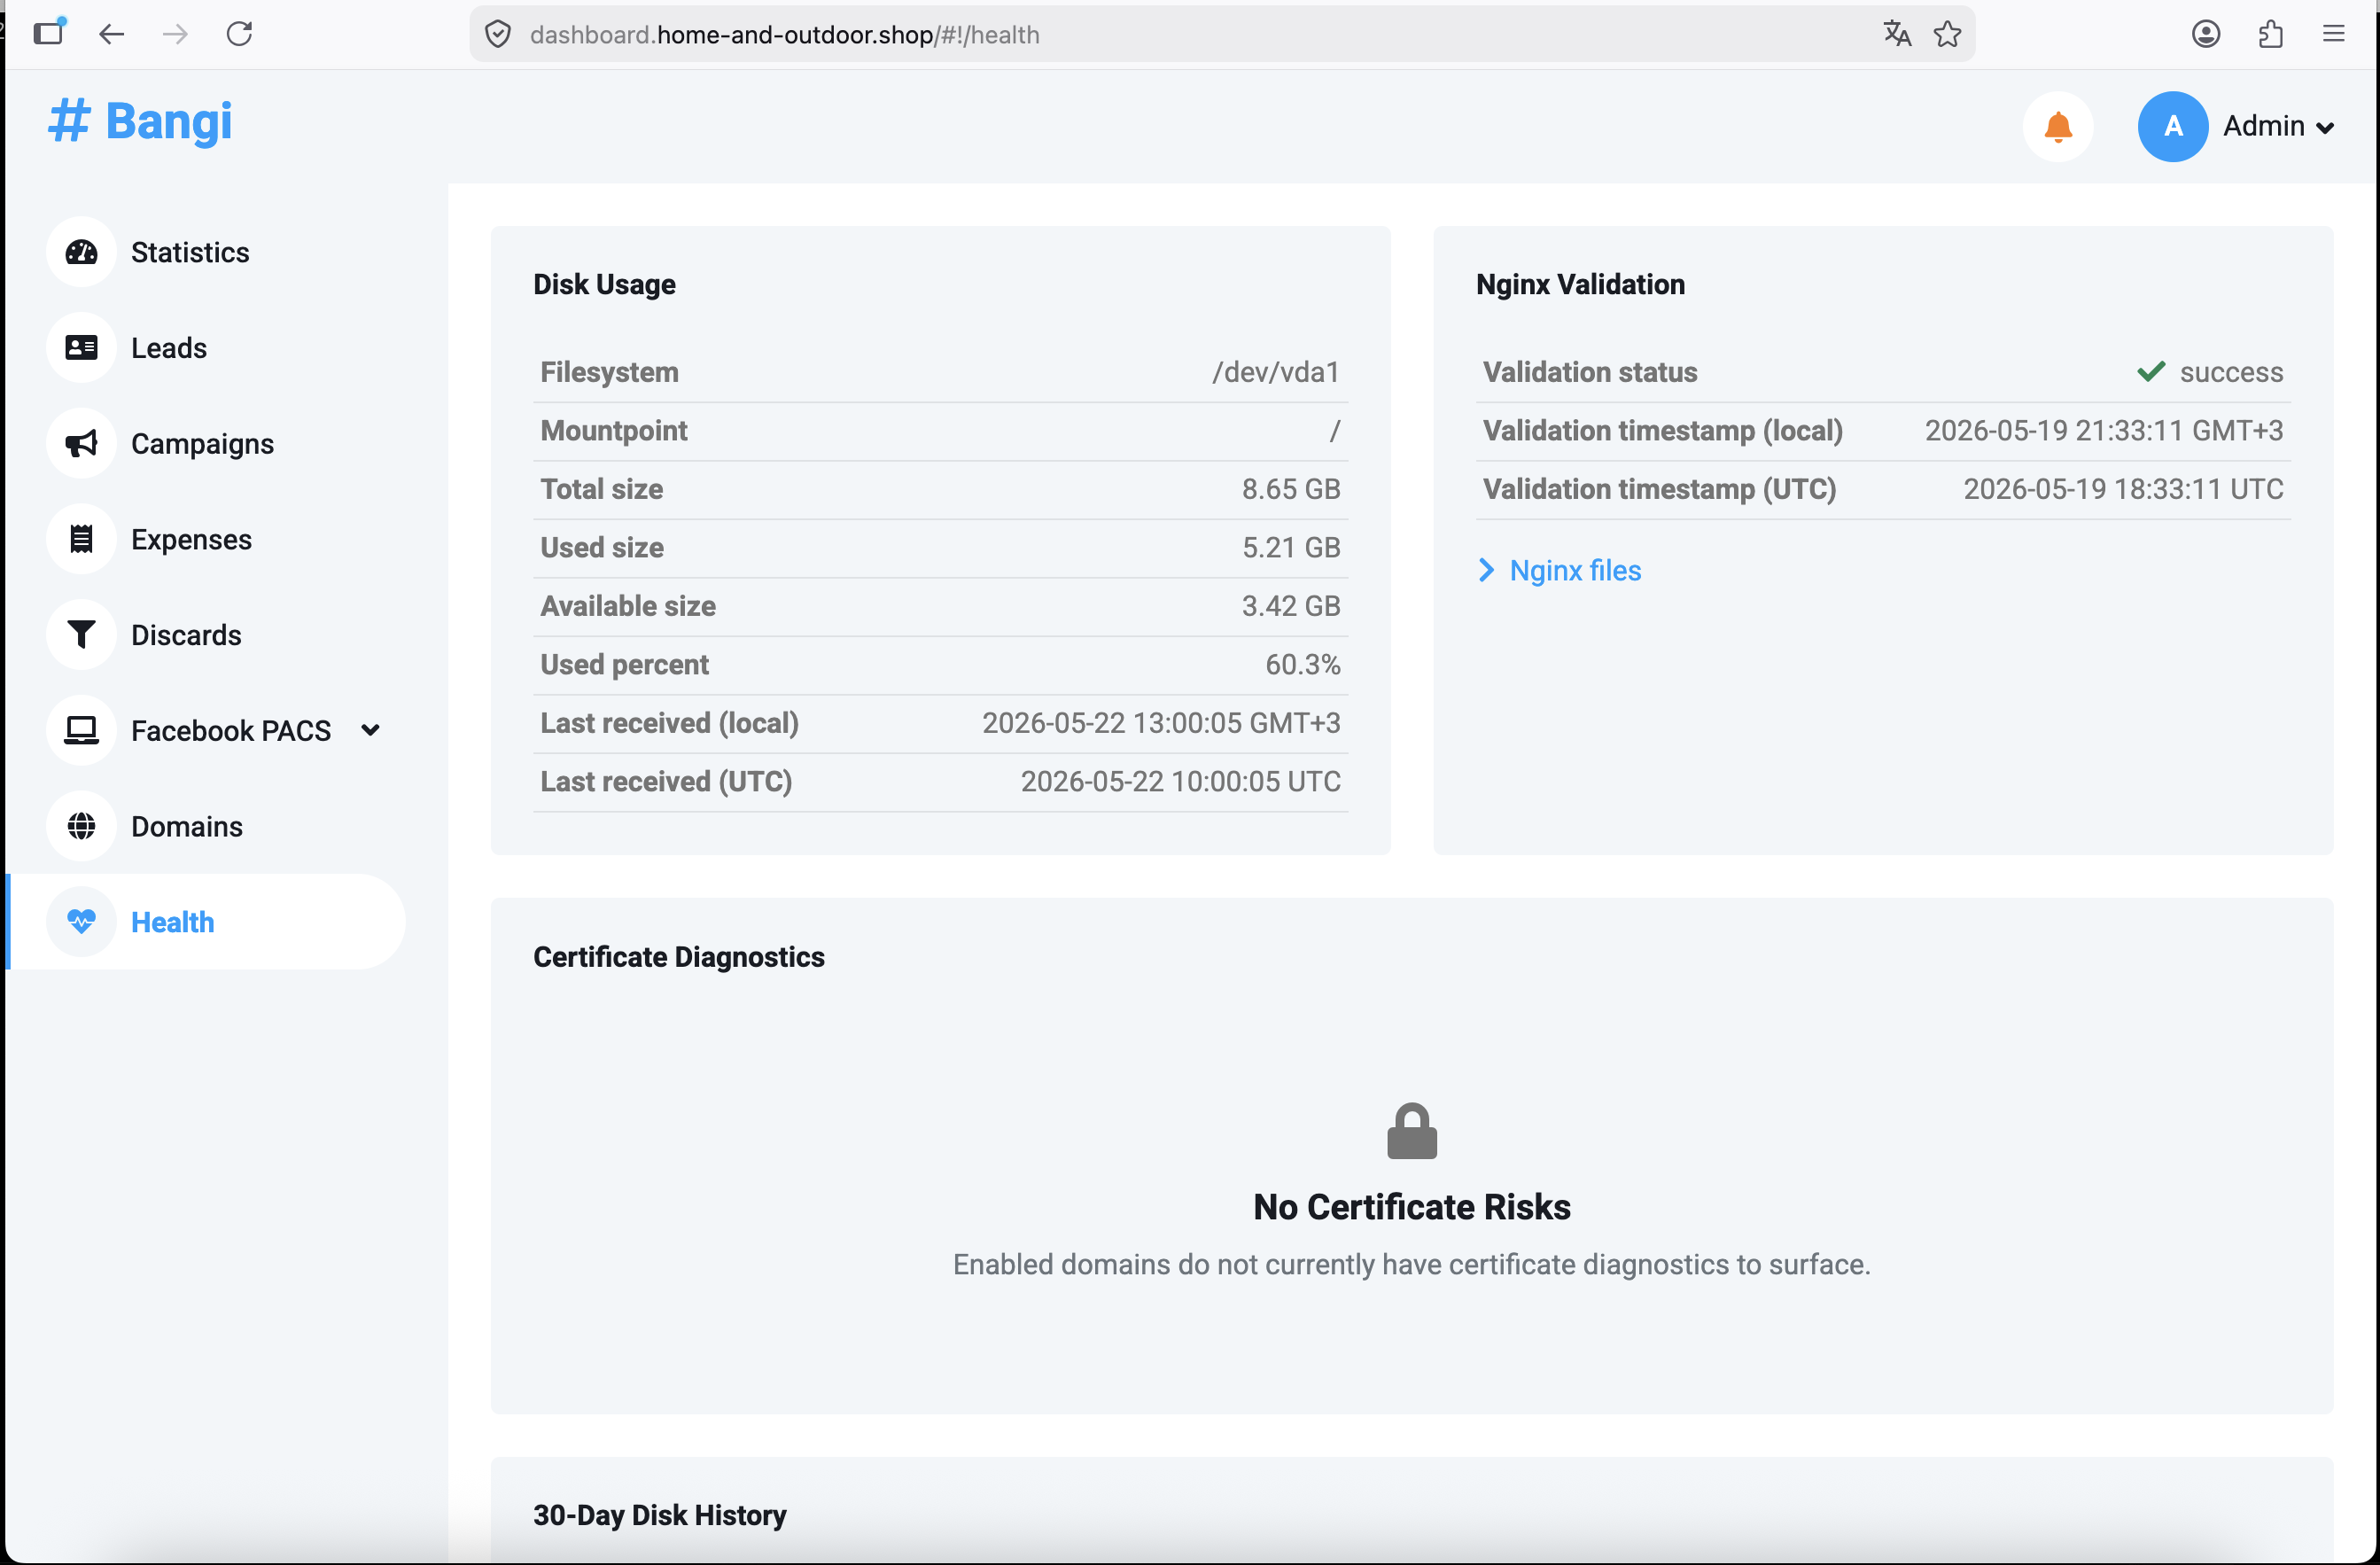
The Health page has four main areas:
| Area | Purpose |
|---|---|
Disk Usage |
Shows the latest storage usage for the tracker host |
Nginx Validation |
Shows whether the latest published Nginx configuration passed validation |
Certificate Diagnostics |
Shows domain certificate risks and DNS readiness |
30-Day Disk History |
Shows storage usage trend over time |
Use this page when alerts mention disk usage, telemetry, certificates, or Nginx.
Disk Usage
The Disk Usage panel shows the server filesystem, mountpoint, total size, used size, available size, used percent, and the time when the latest telemetry was received.
| Signal | Meaning | What to do |
|---|---|---|
| Used percent is normal | Storage has enough free space | No action needed |
| Used percent is high | The server is approaching the warning threshold | Plan cleanup or increase disk size |
| Used percent is critical | The server may run out of space soon | Free space or increase disk size immediately |
| Telemetry is stale | The tracker has not received a recent disk usage report | Check whether the telemetry job is running on the server |
| Never Reported | No disk telemetry has been received yet | Wait for the first report or check the telemetry setup |
High disk usage can affect database writes, logs, certificate renewals, and other background jobs. Treat critical disk alerts as urgent.
30-Day Disk History
Use 30-Day Disk History to understand whether disk usage is stable or growing.
Practical examples:
| Pattern | What it suggests |
|---|---|
| Slowly rising line | Normal growth from traffic, logs, or stored data |
| Sudden jump | A large import, log spike, failed cleanup, or unexpected file growth |
| Line near the top of the chart | The server needs cleanup or a larger disk |
If disk usage grows every day, do not wait for a critical alert. Plan cleanup or storage expansion before the server becomes unstable.
Nginx Validation
The Nginx Validation panel shows whether the latest Nginx configuration validation succeeded or failed.
Nginx is responsible for serving tracker domains and routing HTTP/HTTPS traffic. If validation fails, new or changed domain configuration may not be safe to publish.
| Status | Meaning | What to do |
|---|---|---|
success |
The latest Nginx validation passed | No action needed |
failed |
The latest validation failed | Read the validation error and review the affected domain or configuration |
| No Validation Snapshot | No published validation result exists yet | This can be normal on a fresh setup |
Open Nginx files when you need to compare available site files with enabled references. If an error is shown, use the exact text as the starting point for troubleshooting.
Certificate Diagnostics
The Certificate Diagnostics table helps you check HTTPS readiness for enabled domains.
| Column | Meaning |
|---|---|
Domain |
The hostname being checked |
Certificate status |
Current certificate state, such as pending, active, failed, or expired |
A record |
Whether the domain DNS A record points to the tracker server |
Expires |
Certificate expiration time |
Last attempt |
Latest certificate issue or renewal attempt |
Failures |
Number of failed attempts |
Failure |
Last failure reason, if available |
Common certificate situations:
| Situation | Likely cause | Resolution |
|---|---|---|
DNS not ready |
The domain A record does not point to the tracker server yet | Fix DNS and wait for propagation |
No certificate |
The domain is enabled but no certificate exists yet | Check DNS first, then wait for certificate issuance |
Failed |
Certificate issuance or renewal failed | Read the failure reason and verify DNS, public IP, and Let's Encrypt reachability |
Expired |
The certificate is no longer valid | Treat as urgent because browsers may block the domain |
Certificate alerts become more urgent when an existing certificate is close to expiry or already expired.
Check Campaign Discards
Go to Discards from the dashboard sidebar.
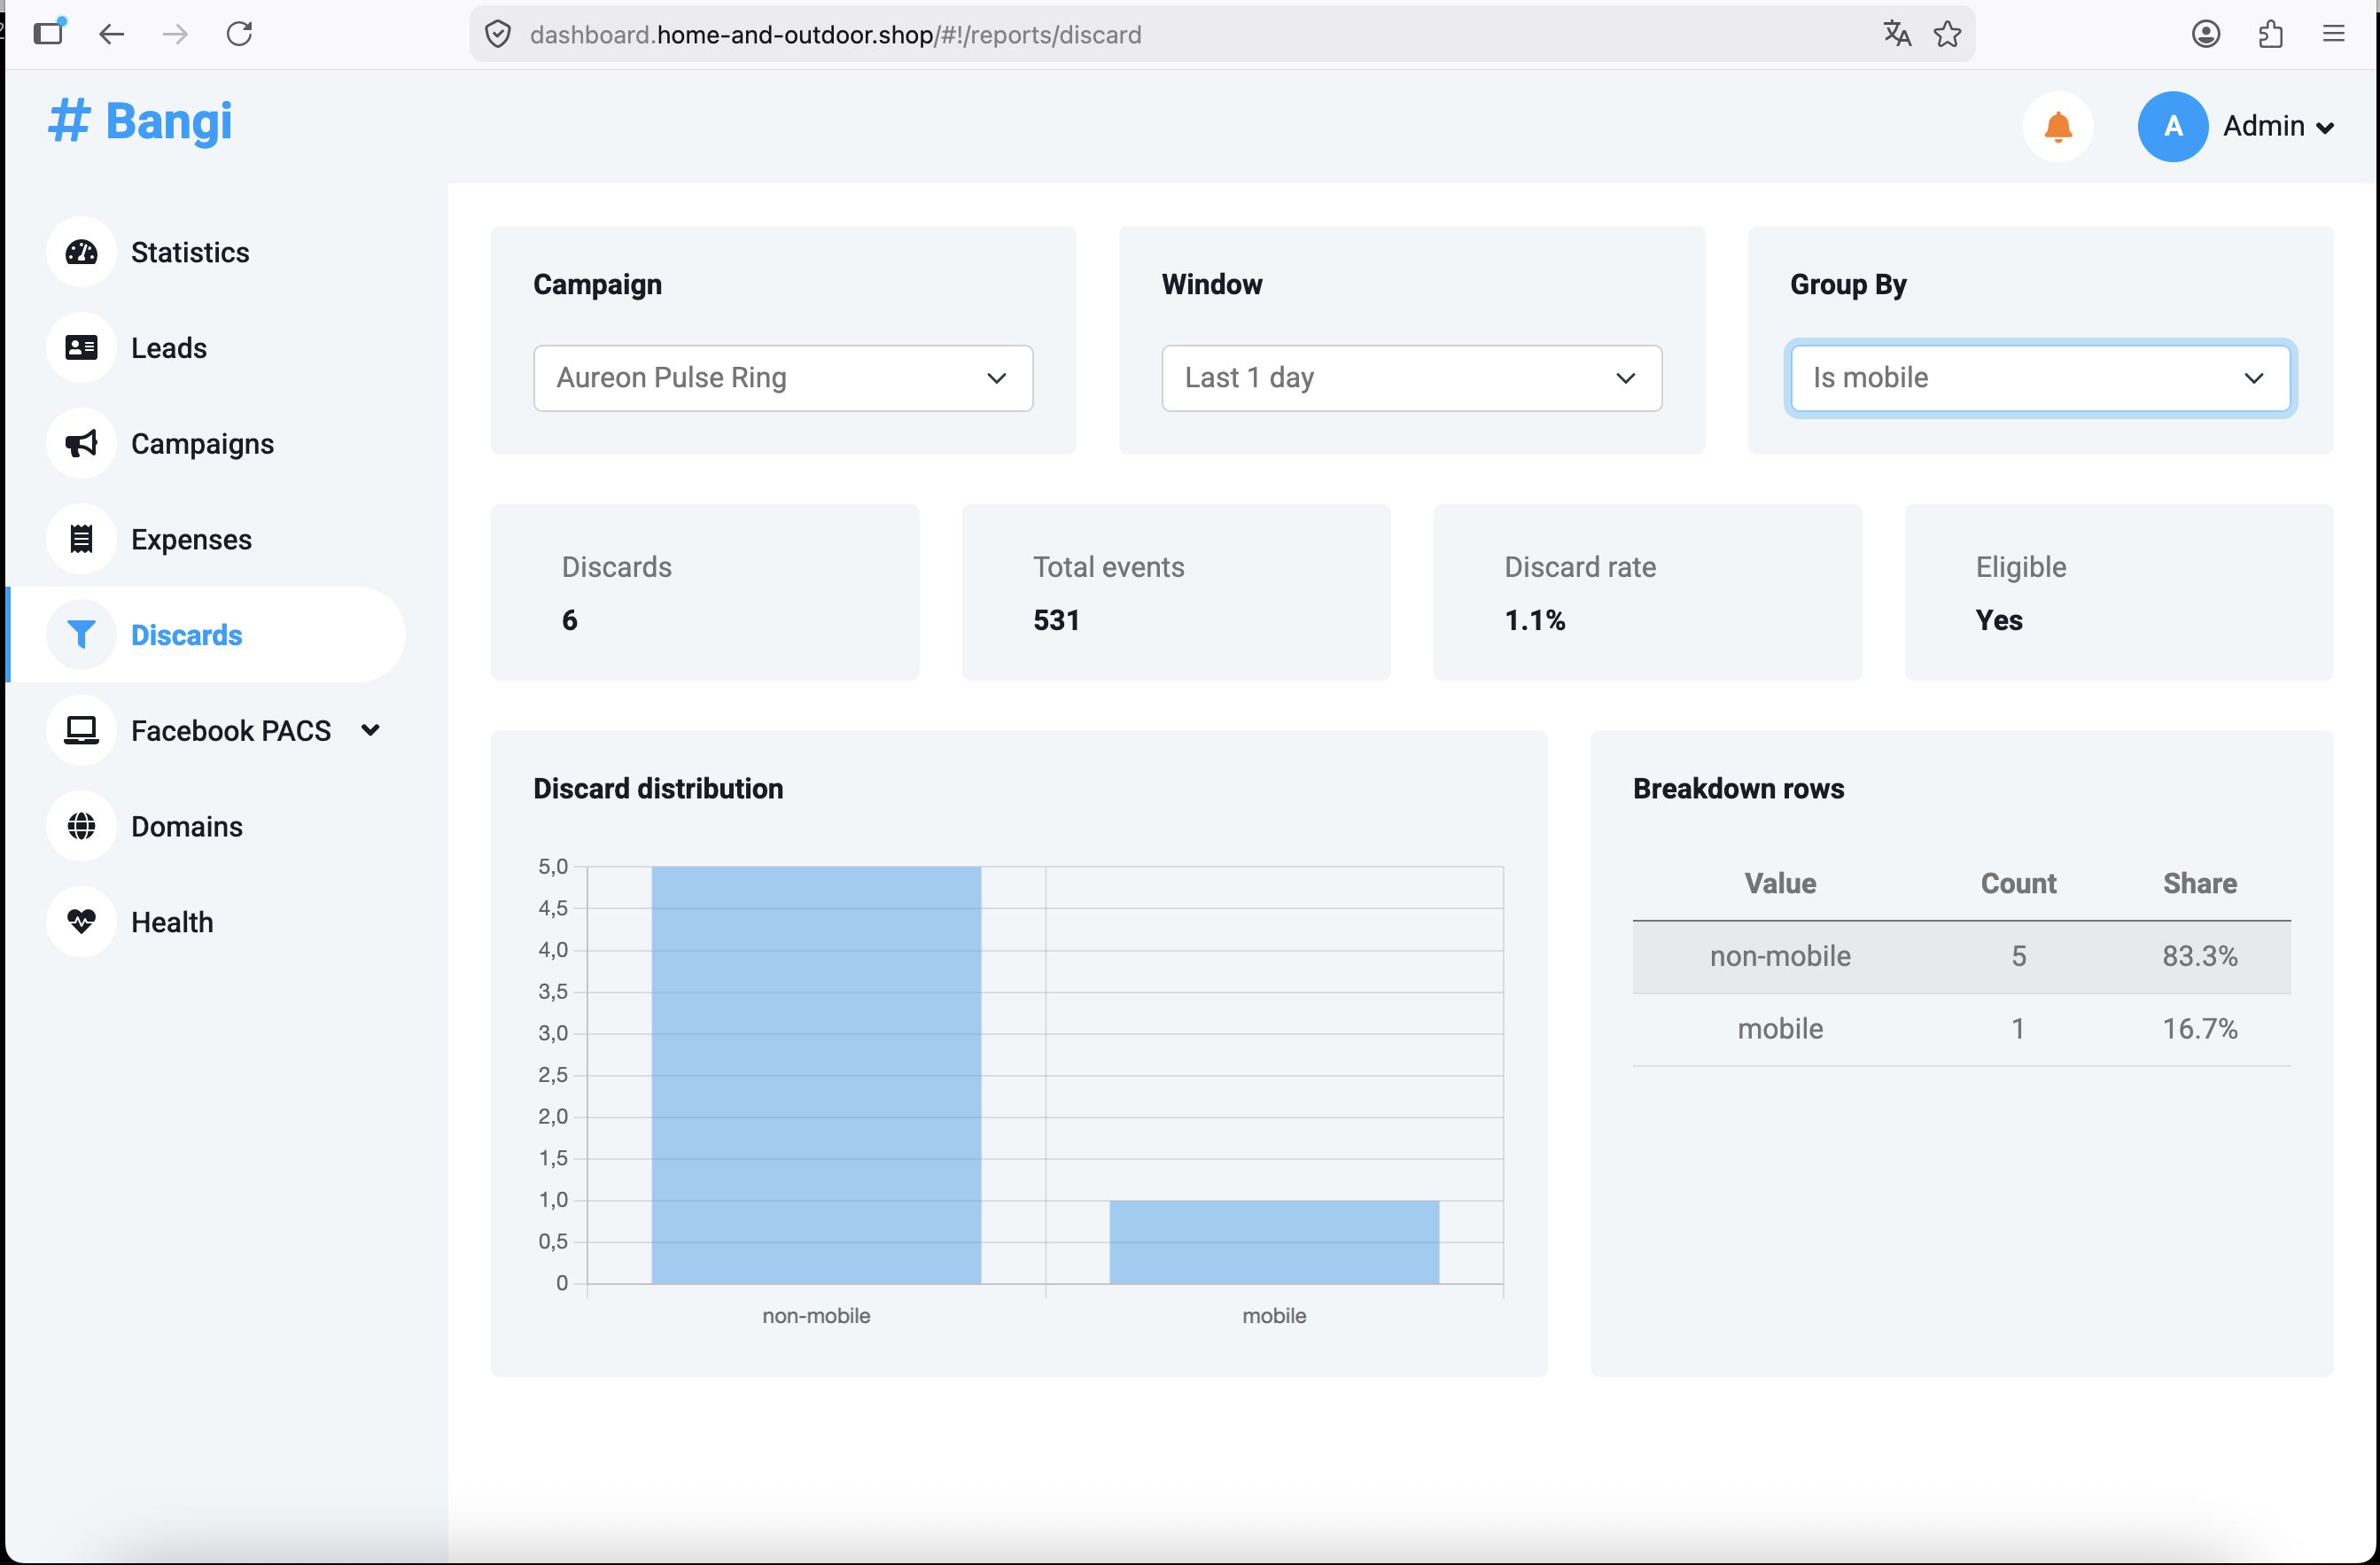
A discard means that a visitor reached a campaign, but the tracker could not route that visit through any matching flow. Discards are usually caused by flow rules that are too strict, missing fallback routing, disabled destinations, or traffic that does not match the expected country, device, browser, or bot conditions.
The Discards page helps answer:
- Which campaign has unmatched traffic?
- How many events were discarded?
- What share of recent traffic was discarded?
- Which countries, browsers, operating systems, devices, mobile states, or bot states appear in discarded traffic?
Choose Campaign, Window, and Grouping
Use the filters at the top of the Discards page.
| Filter | Description |
|---|---|
Campaign |
Campaign to inspect |
Window |
Time range: last 5 minutes, last 1 hour, or last 1 day |
Group By |
Dimension used to split discarded traffic |
Available grouping dimensions:
| Group By | Use it to check |
|---|---|
Country |
Whether traffic from a country has no matching flow |
Browser family |
Whether browser rules are excluding visitors |
OS family |
Whether operating system rules are excluding visitors |
Is mobile |
Whether mobile or desktop traffic is missing a route |
Device family |
Whether a specific device type is excluded |
Is bot |
Whether bot filtering explains the discarded traffic |
Read Discard Summary
The summary cards show:
| Metric | Meaning |
|---|---|
Discards |
Number of discarded events in the selected window |
Total events |
Total tracked events used for the discard calculation |
Discard rate |
Discards divided by total events |
Eligible |
Whether there is enough traffic to treat the rate as meaningful |
Small numbers can be noisy. The system treats a campaign as eligible for discard alerting only after enough recent events exist. This prevents alerts from being triggered by one or two early visits.
Read the Distribution
The chart and table show where discards are concentrated.
Examples:
| What you see | What it may mean |
|---|---|
| Most discards are from one country | No flow matches that country, or the country rule is too strict |
| Most discards are mobile users | Flows may target desktop only, or mobile routing is missing |
| Most discards are bots | Bot rules may be working as expected |
| Discards are spread across all values | A default or fallback flow may be missing |
| Discards started recently | A recent flow, rule, domain, or destination change may be responsible |
Use the distribution to decide which campaign flow rule to inspect first.
Fix Common Problems
| Problem | Likely cause | Resolution |
|---|---|---|
| Campaign has many discards | No flow matches part of the traffic | Add or adjust a matching flow |
| Only one country is discarded | Country rule does not include that country | Add the country to the intended flow or create a separate flow |
| Mobile traffic is discarded | Flow rules target desktop only | Add mobile routing or change the device condition |
| Bot traffic is discarded | Bot filtering may be intentional | Confirm whether this is expected for the campaign |
| Discards appear after a campaign edit | A new rule is too strict or a fallback was removed | Review the latest flow changes |
| Discards are high across all dimensions | Campaign may not have a broad fallback flow | Add a default flow for traffic that does not match specific rules |
| Certificate is failed or expired | DNS or certificate issuance has a problem | Fix DNS or certificate issue from Health before testing traffic again |
| Nginx validation failed | Published web server configuration is inconsistent | Review the validation error in Health |
| Disk usage is critical | Server storage is almost full | Free disk space or increase server storage |
Recommended Troubleshooting Flow
When something looks wrong, use this order:
- Open
Alertsand identify the highest severity alert. - If the alert mentions disk, telemetry, certificate, or Nginx, open
Health. - If the alert mentions campaign discards, open
Discards. - Fix the most concrete problem first: expired certificate, failed Nginx validation, critical disk usage, or a missing campaign route.
- Generate a small amount of test traffic.
- Recheck
Alerts,Health, andDiscards. If the alert still appears after the fix, wait for the next automatic alert refresh or refresh the dashboard manually.
Practical Examples
Example: Certificate Alert
The alert says:
Certificate renewal failed for example.com and expires within 7 days.
Open Health, find example.com in Certificate Diagnostics, and check A record, Last attempt, Failures, and Failure.
If the A record is not set, fix DNS first. If DNS is correct, use the failure reason to continue troubleshooting.
Example: Campaign Discard Alert
The alert says:
Campaign "Aureon Pulse Ring" has discards. 5m: 1/25 (4.0%), 1h: 3/45 (6.7%), 1d: 12/55 (21.8%). Review flow routing.
Open Discards, select Aureon Pulse Ring, choose Last 1 hour, and group by Country, Is mobile, or Is bot.
If one value dominates the table, inspect the flow rules that should handle that traffic. If all values are affected, check whether the campaign has a fallback flow.
Example: Stale Telemetry Alert
The alert says that host disk telemetry is stale.
Open Health and check Last received. If the timestamp is old, the dashboard may no longer know the current disk state. Check the server telemetry job before relying on the disk usage number.
Troubleshooting Checklist
Use this checklist when a system problem is unclear:
- Check the highest severity alert first.
- Confirm whether the problem is infrastructure-related or campaign-routing-related.
- For infrastructure issues, inspect
Health. - For campaign routing issues, inspect
Discards. - Check DNS before troubleshooting certificates.
- Check Nginx validation after domain or certificate changes.
- Check disk usage before investigating strange write, logging, or background job failures.
- Check discard distribution before changing multiple flow rules.
- After each fix, retest with a small amount of traffic and recheck the alert bell.
- Remember that alerts refresh automatically about once every 10 minutes, so a resolved alert may not disappear instantly.
Need Help?
If you cannot identify or resolve the problem, contact Bangi support at support@bangi.tech. Include the alert message, affected campaign or domain, screenshots from Health or Discards, and what you already tried.