Statistics Report
The Statistics report helps you understand campaign performance from traffic to profit. Use it to answer practical questions such as:
- How many clicks did the campaign receive?
- How many leads were accepted, expected, rejected, or marked as trash?
- Which flows, ads, traffic sources, countries, devices, or browsers perform best?
- Is the campaign profitable after expenses?
This article uses the Aureon Pulse Ring campaign as an example. The same workflow applies to any campaign that has recorded clicks, leads, postbacks, and expenses.
Key Concepts
Before reading the report, it helps to understand the main metrics.
| Metric | Meaning |
|---|---|
Clicks |
Number of tracked visits for the selected campaign and date range. |
Accept |
Leads with the accepted status. These usually count as approved conversions. |
Expect |
Leads with the expected status. These usually wait for advertiser approval. |
Reject |
Leads rejected by the advertiser, network, or your status mapping. |
Trash |
Invalid, duplicate, test, or excluded leads. |
Payout Accept |
Revenue from accepted leads only. |
Payout Expect |
Revenue from accepted and expected leads together. |
Expenses |
Campaign cost entered in the Expenses report. |
Profit Accept |
Accepted payout minus expenses. |
Profit Expect |
Accepted and expected payout minus expenses. |
ROI Accept |
Return on investment calculated from accepted payout and expenses. |
ROI Expect |
Return on investment calculated from accepted and expected payout and expenses. |
Accepted metrics are more conservative because they count only approved revenue. Expected metrics are useful for forecasting, but they can change when expected leads are later approved or rejected by the advertiser.
Prerequisites
Before you use the Statistics report, verify that you have the following items.
| Requirement | Description | How to verify |
|---|---|---|
| Campaign | The campaign exists in the tracker | Open Campaigns and confirm the campaign is listed |
| Clicks | Visitors have opened the campaign tracking URL | Open Statistics and check whether clicks appear |
| Leads or postbacks | The campaign has conversion data | Open Leads or check postback integration |
| Expenses | Costs are entered if you want profit and ROI | Open Expenses and check the campaign report |
You can use the Statistics report without expenses, but profit and ROI become meaningful only after campaign costs are entered.
Step 1: Open the Statistics Report
Open the tracker dashboard and go to Statistics.
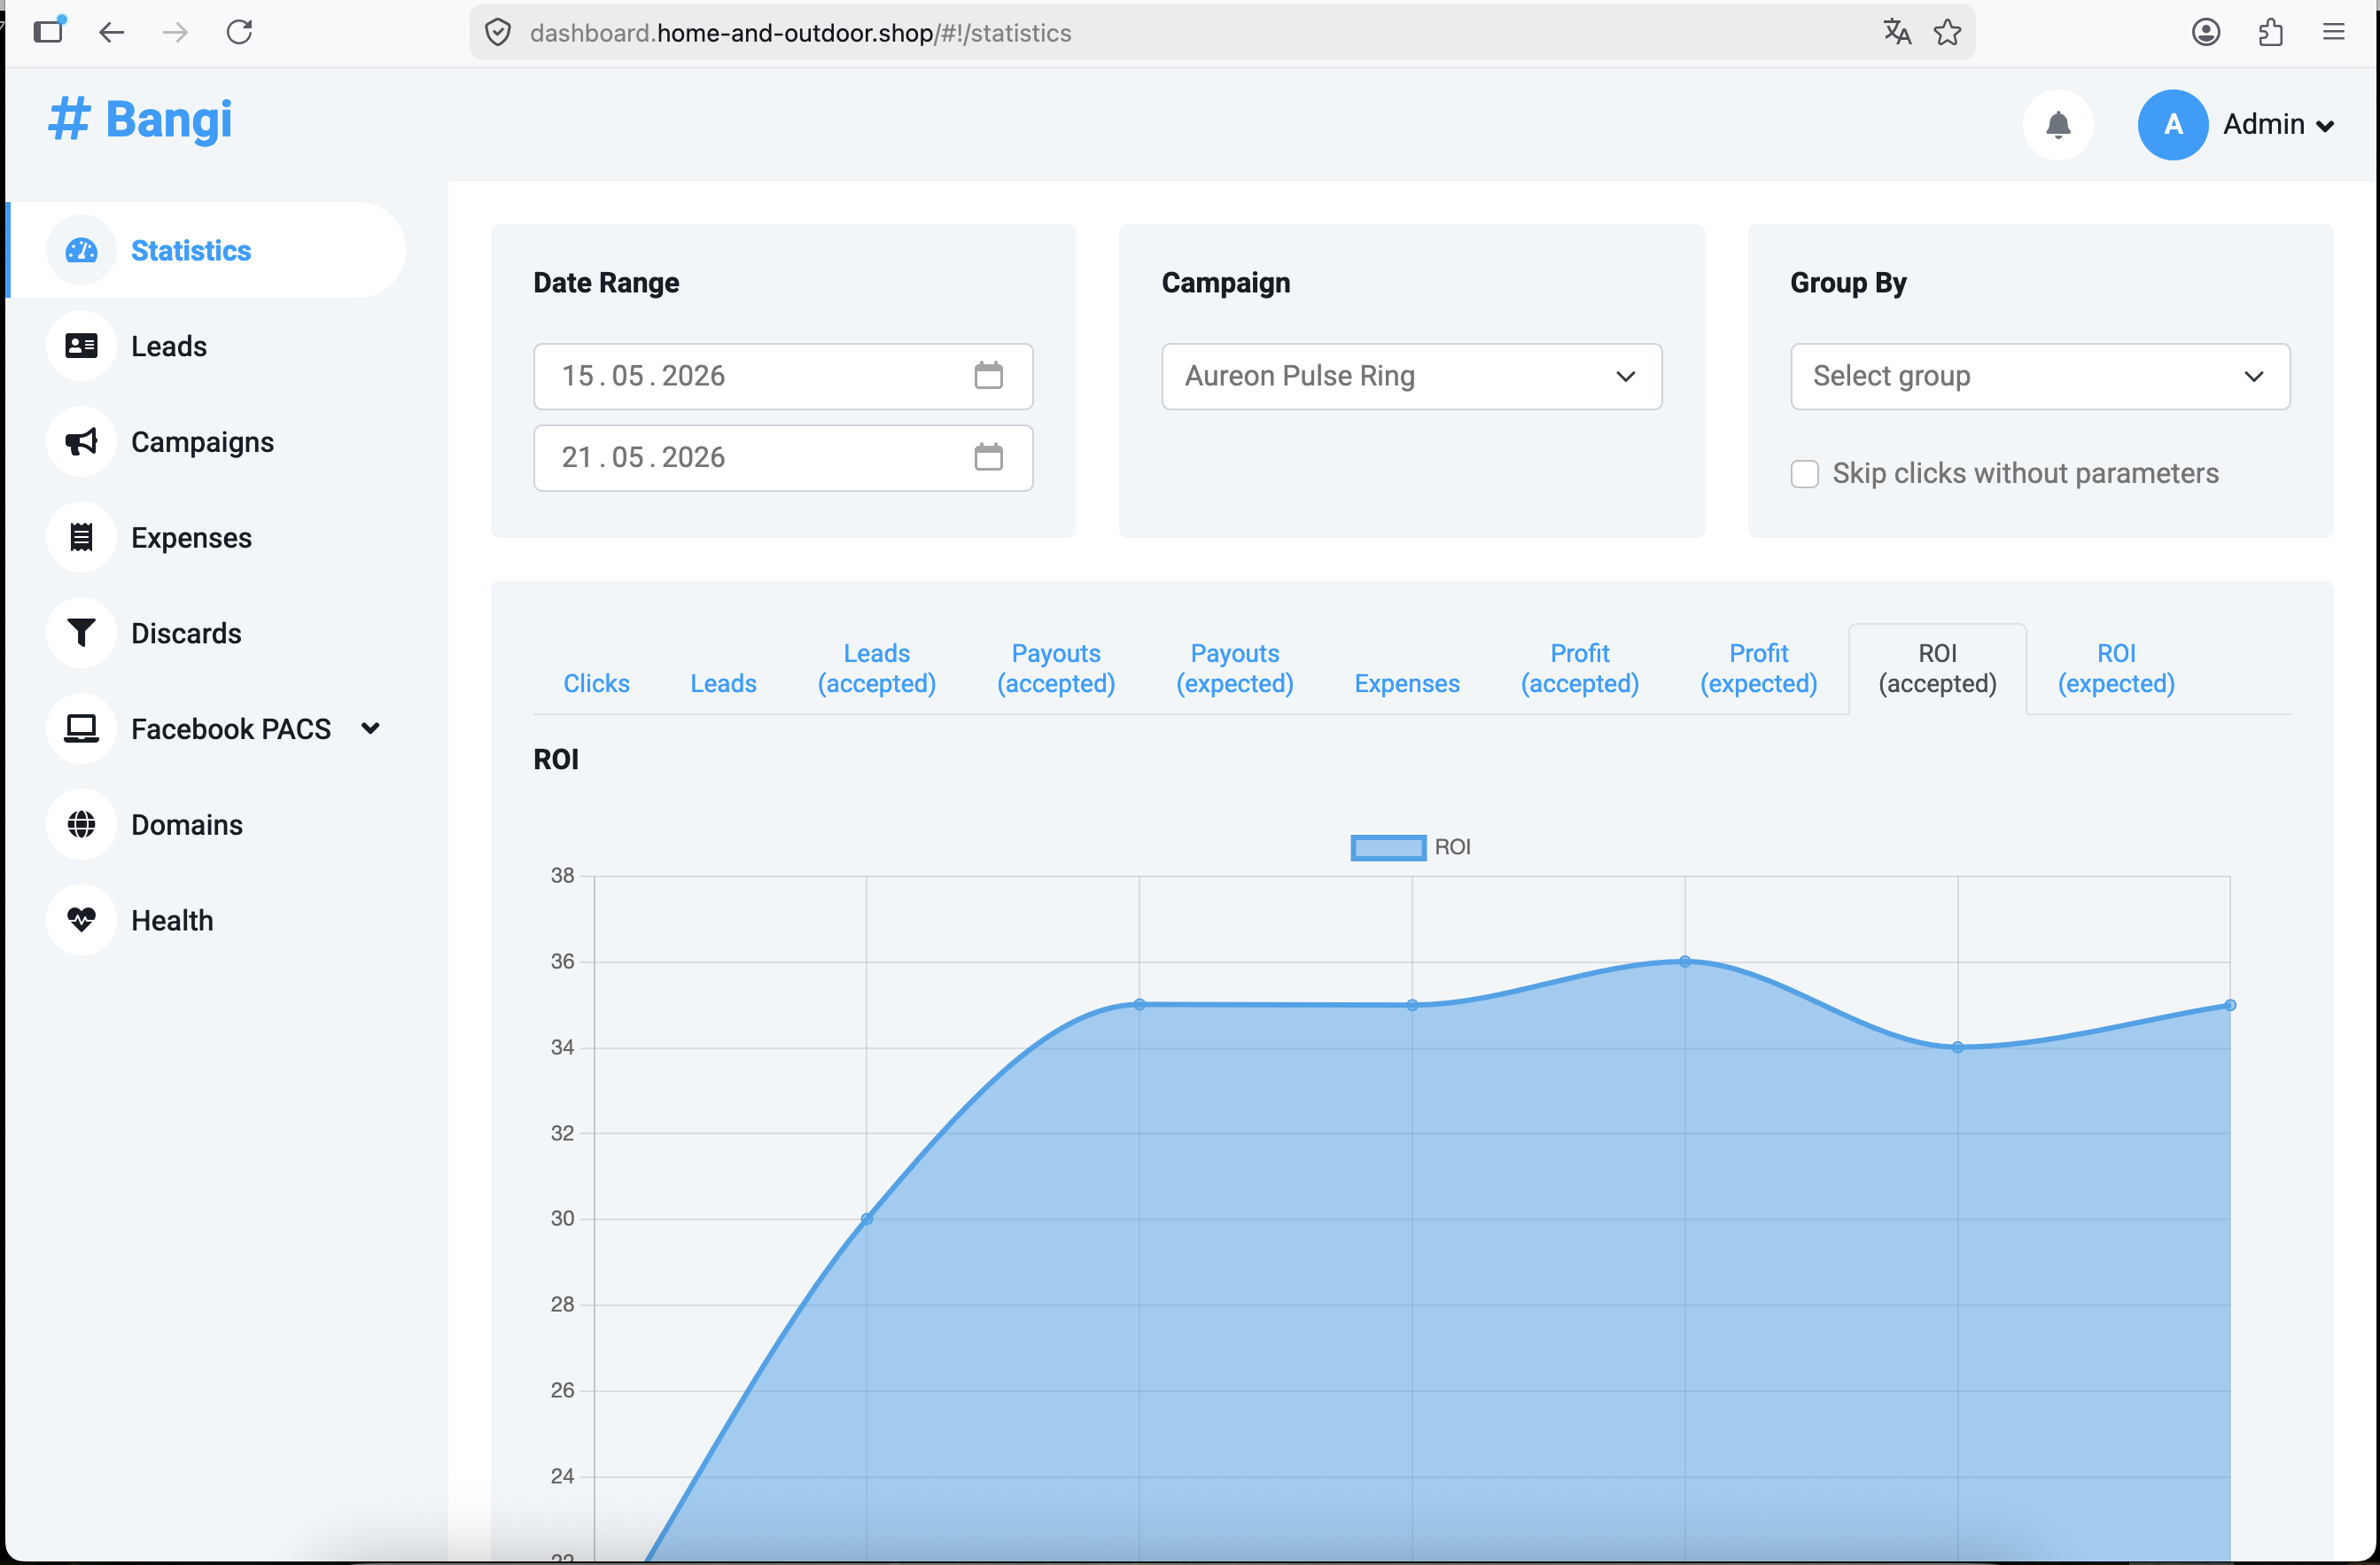
The page has three main areas:
| Area | Purpose |
|---|---|
| Filters | Select the date range, campaign, and optional grouping parameter. |
| Chart | Visualize one metric over time. |
| Table | Read daily values and totals in a detailed report. |
Step 2: Select the Date Range and Campaign
Use Date Range to choose the period you want to analyze.
Then select the campaign in Campaign. In this example, the selected campaign is:
Aureon Pulse Ring
Every chart and table value updates from these filters. If the report looks empty, first check that the selected dates include real campaign traffic.
Step 3: Read the Chart
The chart shows one selected metric across the date range.
Use the chart tabs to switch between metrics:
| Tab | Use it to check |
|---|---|
Clicks |
Traffic volume by day. |
Leads |
Total lead volume by day. |
Leads (accepted) |
Approved lead volume by day. |
Payouts (accepted) |
Approved revenue by day. |
Payouts (expected) |
Approved plus expected revenue by day. |
Expenses |
Cost by day. |
Profit (accepted) |
Profit based on approved revenue only. |
Profit (expected) |
Profit based on approved and expected revenue. |
ROI (accepted) |
ROI based on approved revenue only. |
ROI (expected) |
ROI based on approved and expected revenue. |
For everyday decisions, start with Profit (accepted) and ROI (accepted). They show the result based on revenue that has already been approved.
Step 4: Read the Statistics Table
Scroll to the Statistics table to inspect exact values.
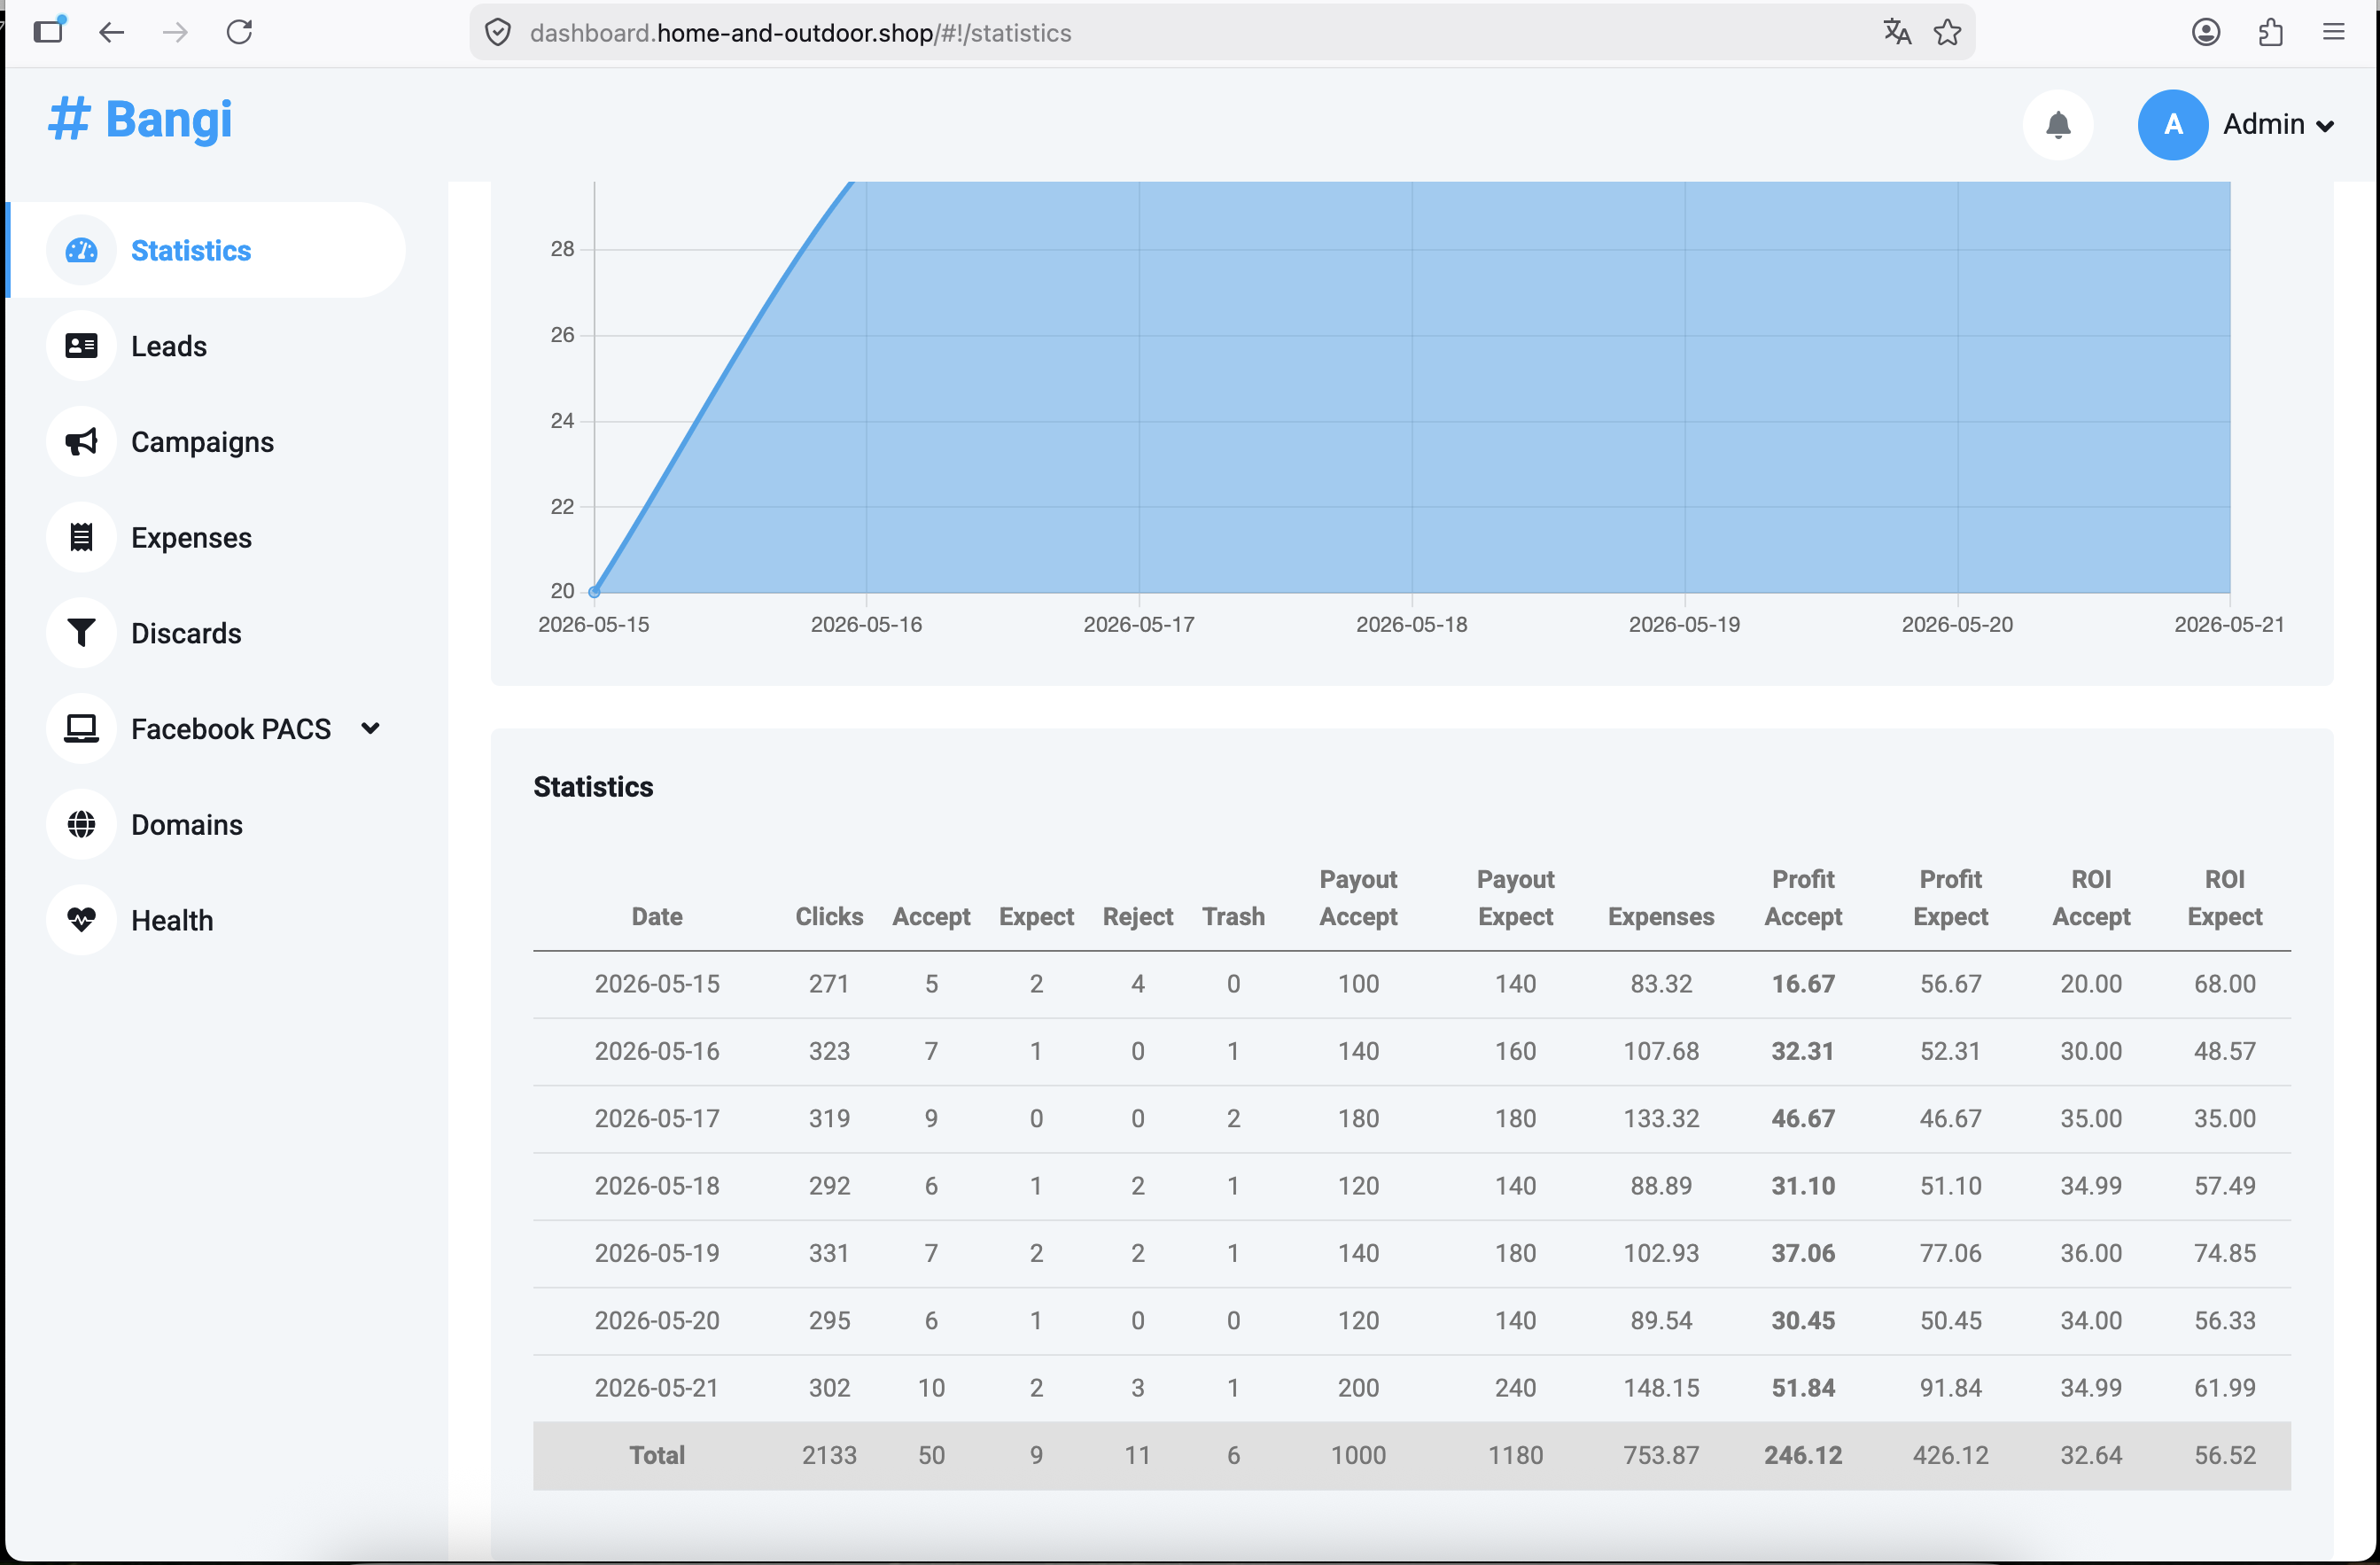
Each row shows one date. The Total row at the bottom sums the whole selected period.
In the example table:
Clicksshows how much traffic was tracked each day.Accept,Expect,Reject, andTrashshow lead status distribution.Payout Acceptshows approved revenue.Payout Expectincludes both approved and expected revenue.Expensesshows daily campaign cost.Profit AcceptandROI Acceptshow conservative profitability.Profit ExpectandROI Expectshow profitability if expected leads are later approved by the advertiser.
Use the table when you need exact numbers. Use the chart when you need to see trends quickly.
Step 5: Group Results by a Parameter
Use Group By when you want to split statistics by one attribute: country, operating system, device type, browser, flow, or a parameter from the campaign URL.
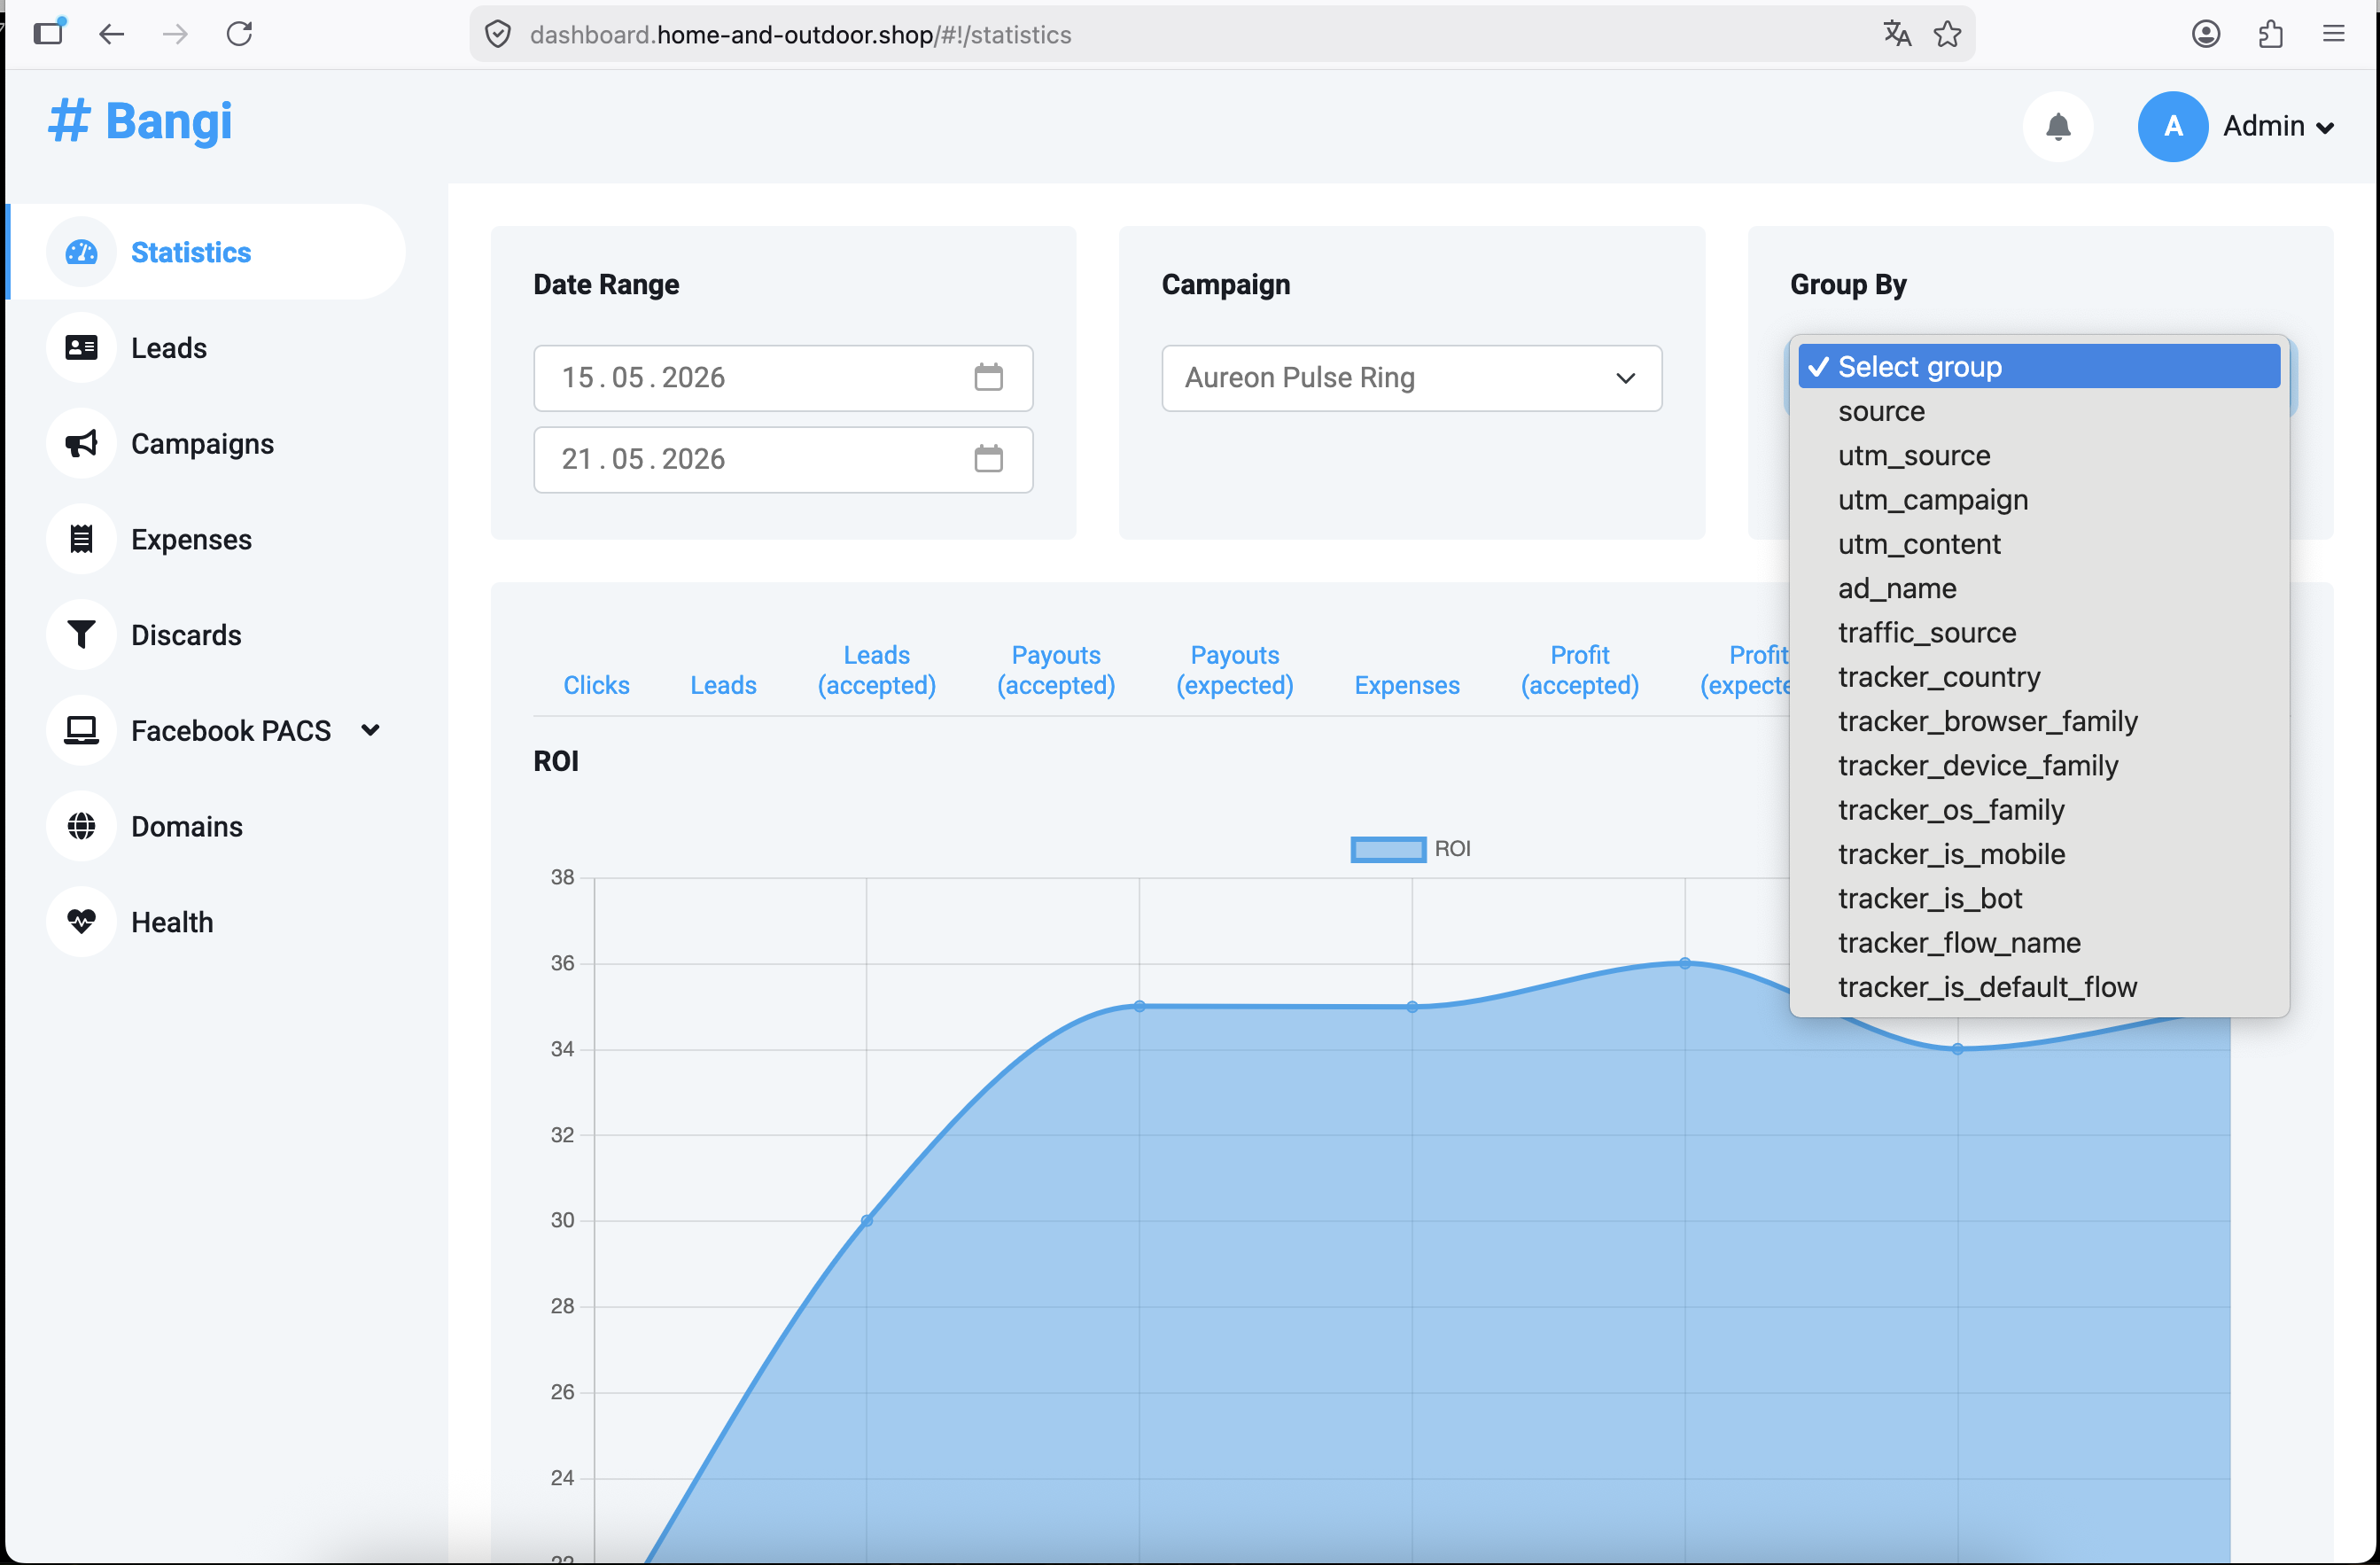
The available parameters depend on the clicks recorded for the selected campaign. The tracker adds some parameters automatically, such as country, browser, device, operating system, and flow name. Other parameters can come from the campaign URL.
For example, if a Facebook ad opens the campaign URL with the ad_name parameter, that parameter can appear in Group By after the tracker records clicks:
https://aureon-pulse-ring.home-and-outdoor.shop/?ad_name=Pulse%20Ring%20Reel
Practical grouping examples:
| Parameter | Useful for |
|---|---|
tracker_country |
Comparing detected visitor countries. |
tracker_browser_family |
Comparing browser families. |
tracker_device_family |
Comparing device families. |
tracker_os_family |
Comparing operating systems. |
tracker_is_mobile |
Comparing mobile and non-mobile traffic. |
tracker_is_bot |
Comparing bot and human traffic. |
tracker_flow_name |
Comparing campaign flows or landing destinations. |
tracker_is_default_flow |
Checking whether traffic used the campaign default flow. |
If a parameter does not appear in the dropdown, the selected campaign and date range may not contain clicks with that parameter.
Step 6: Compare Flow Performance
Select tracker_flow_name in Group By to compare campaign flows.
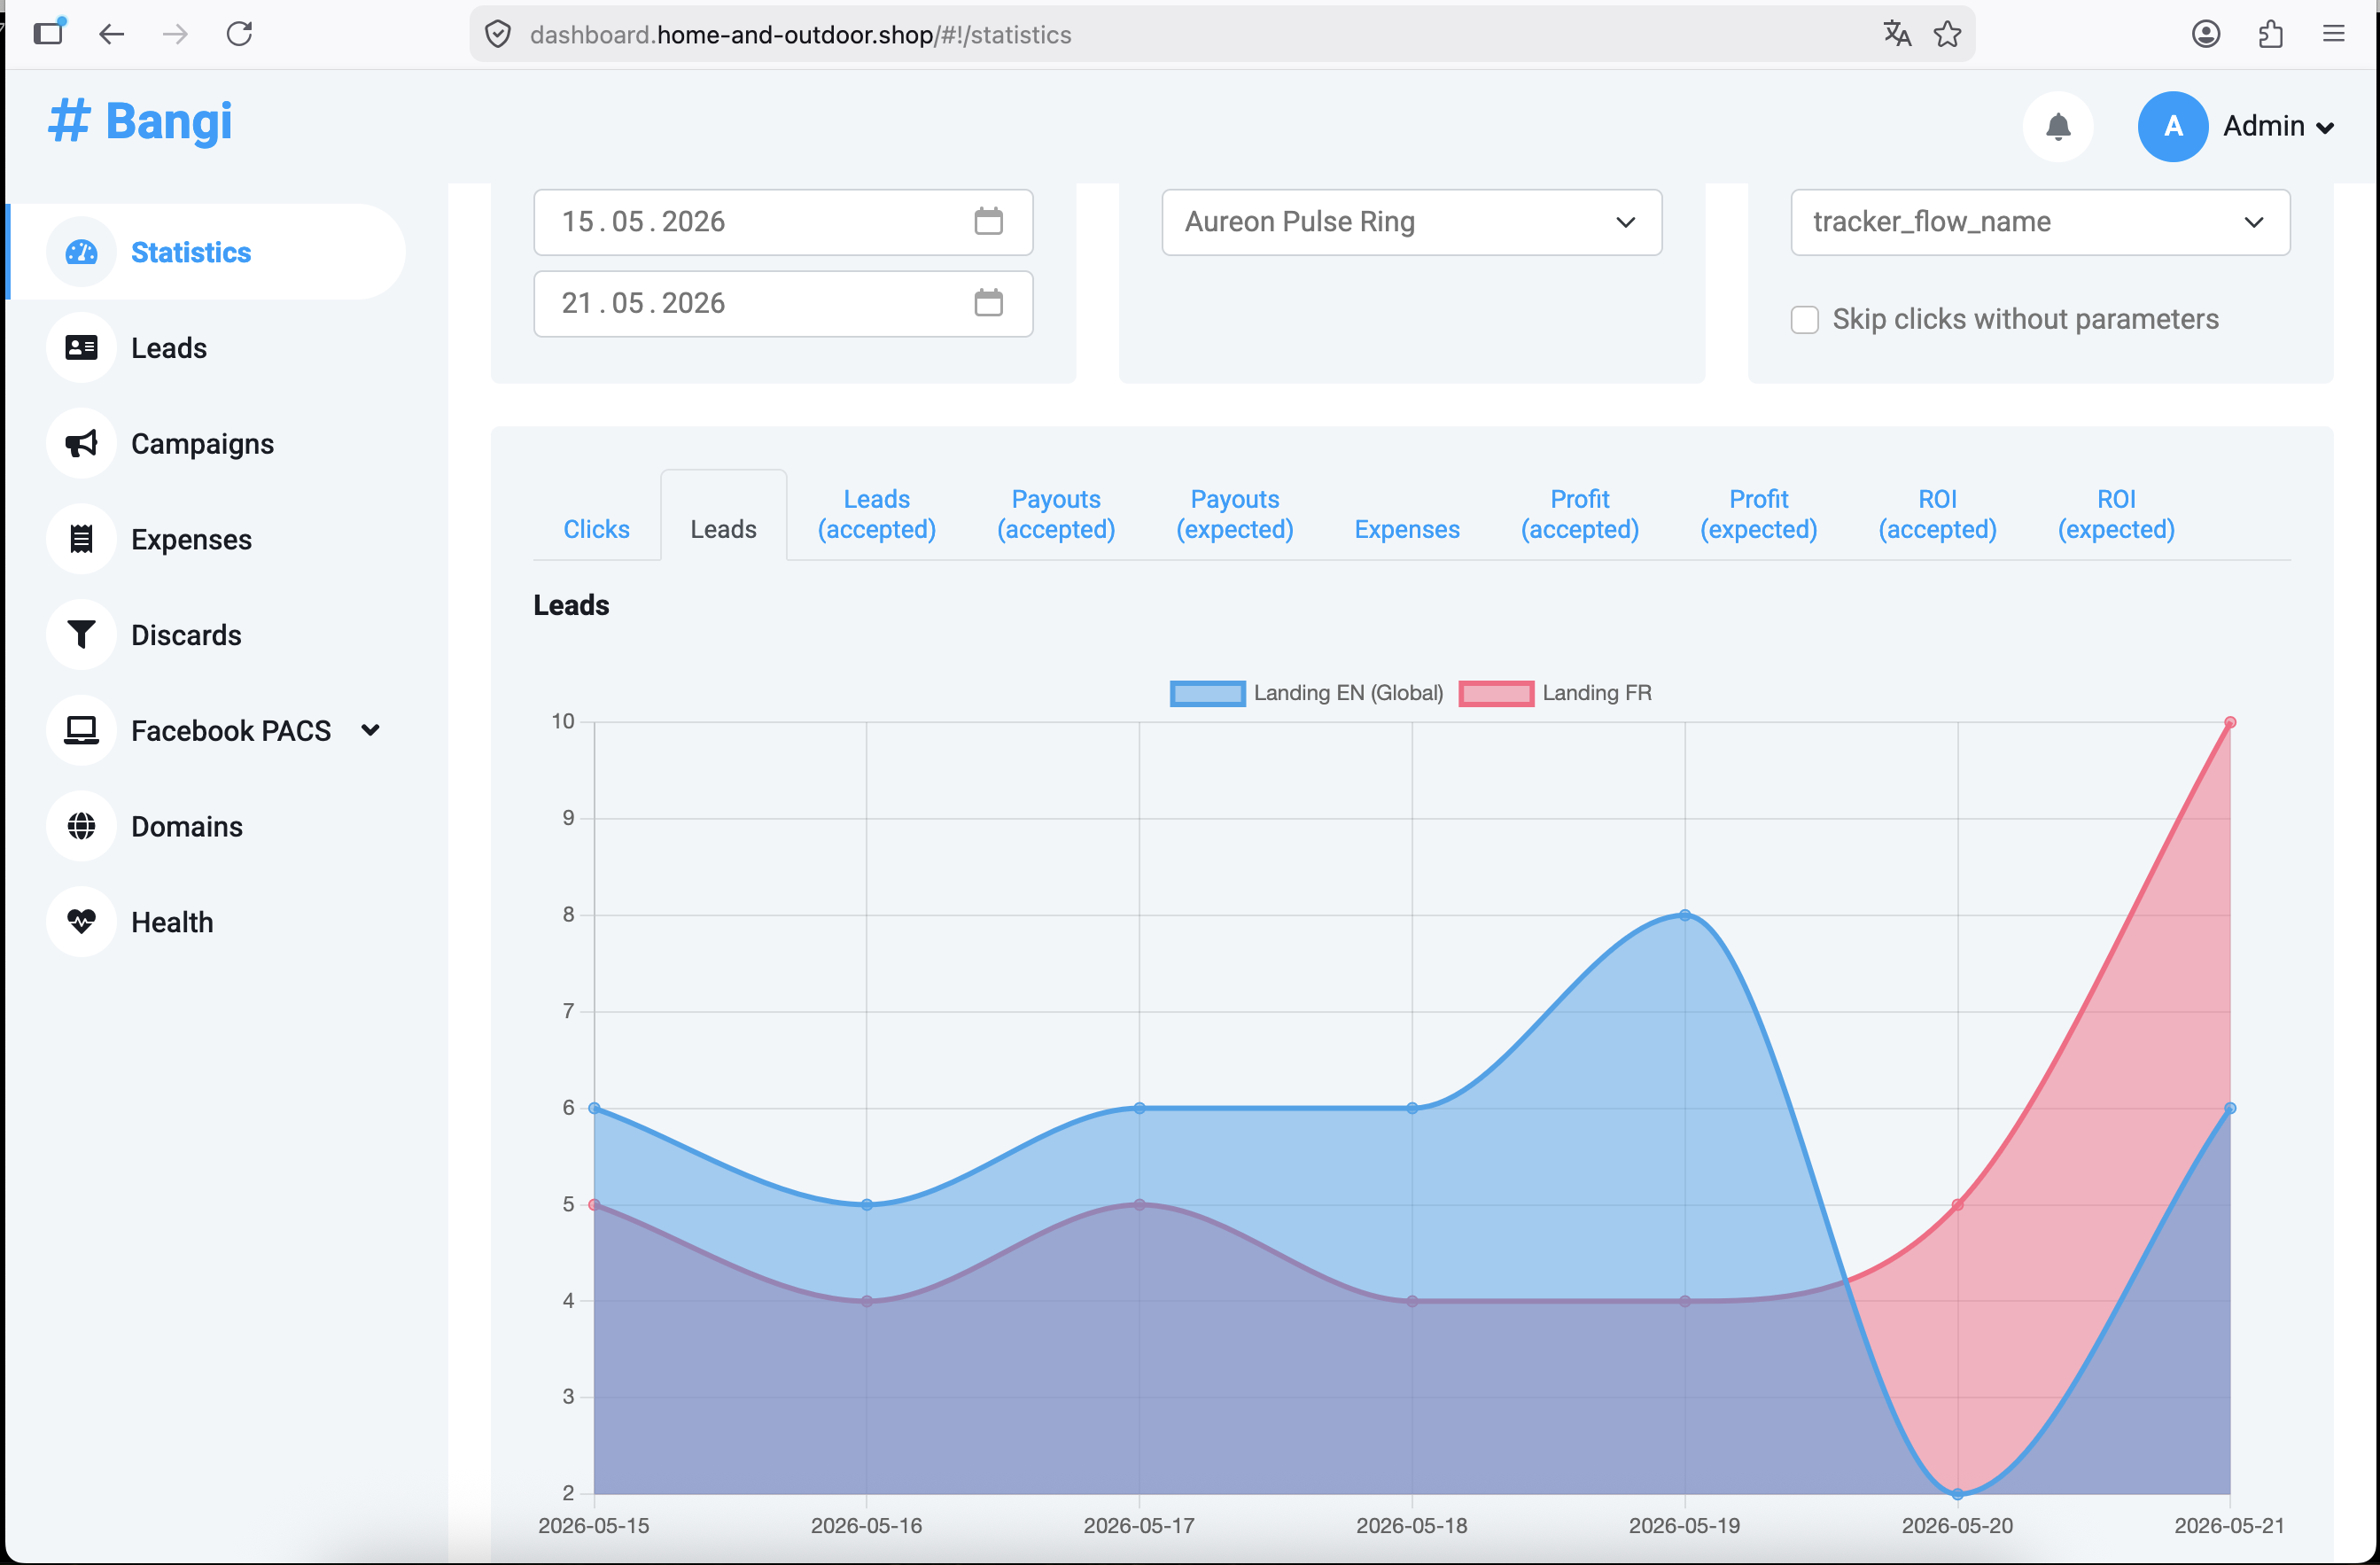
This view is useful when a campaign routes visitors to different landings or destinations. In the example, the chart compares two flows:
Landing EN (Global)Landing FR
Use this grouping to check whether one flow receives more leads, better accepted leads, or stronger ROI than another flow.
Step 7: Enter Expenses for Profit and ROI
Profit and ROI depend on expenses. To enter campaign costs, open Expenses.
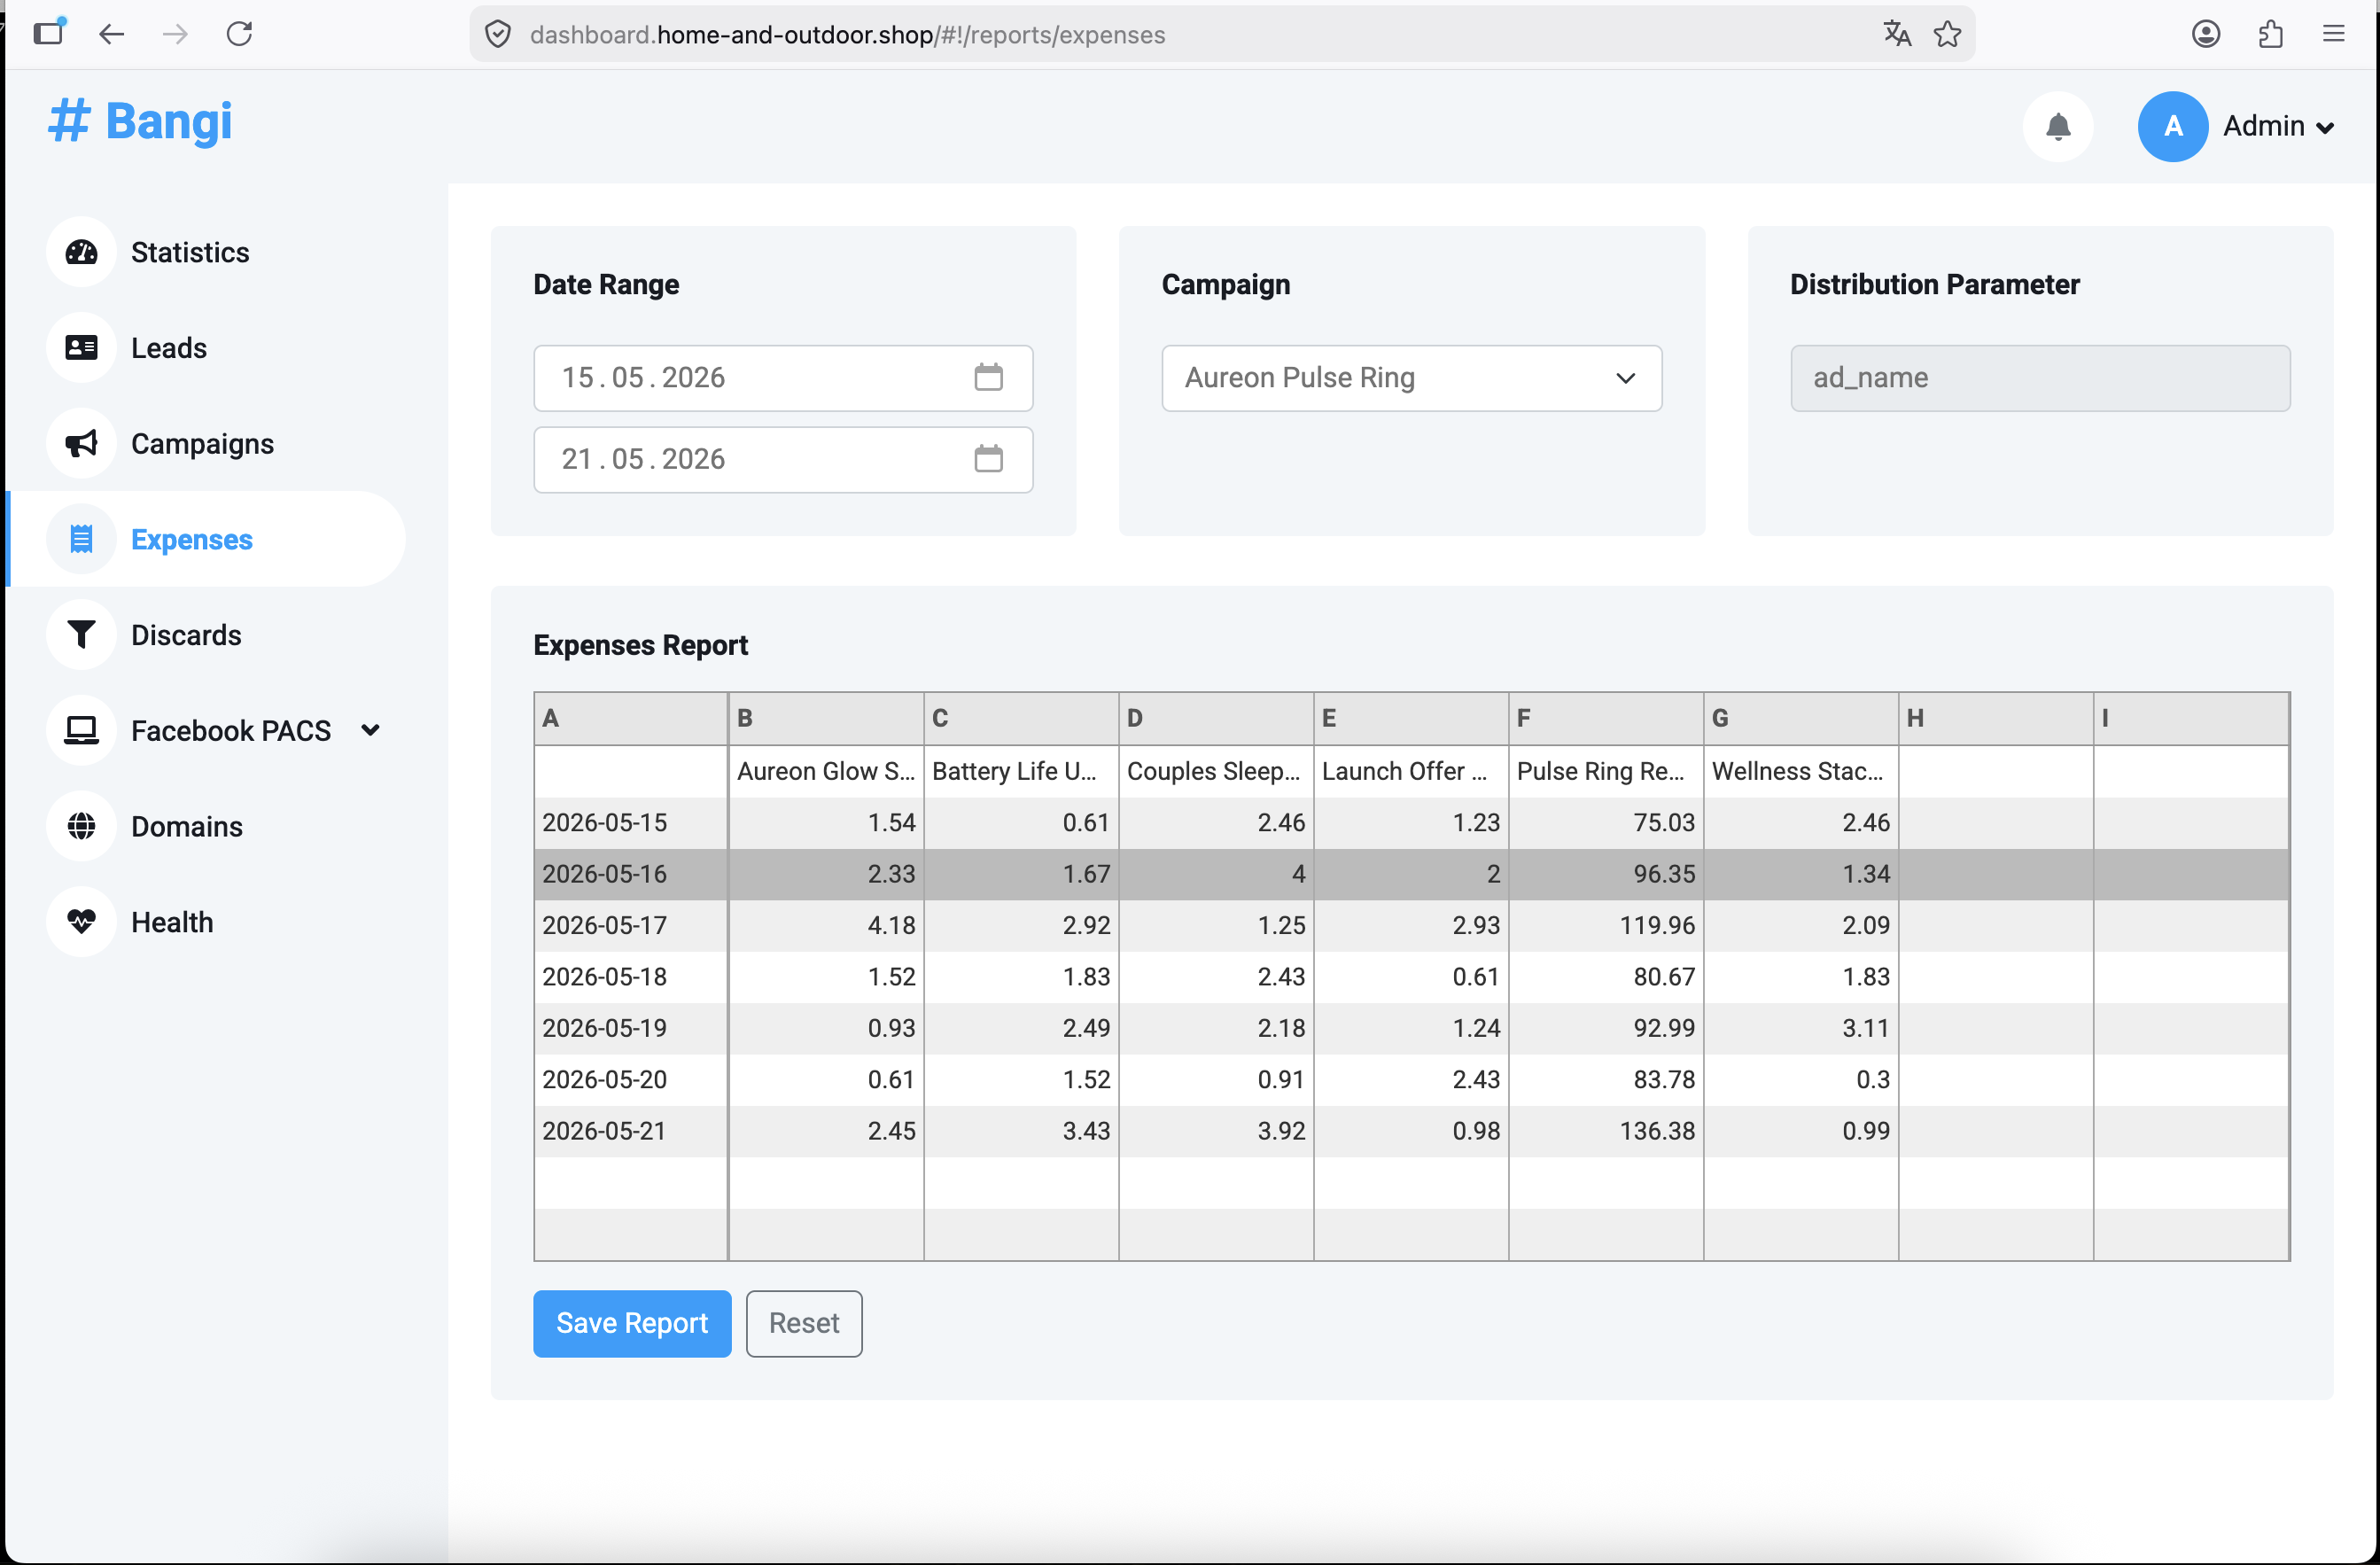
The Expenses report lets you distribute cost by date and parameter. In the example, costs are distributed by ad_name.
Use the same distribution parameter in Statistics when you want a fair profitability comparison. For example, if expenses are entered by ad_name, group Statistics by ad_name before reading profit and ROI.
Step 8: Analyze Profit by Expense Distribution Parameter
After expenses are entered by ad_name, return to Statistics and select ad_name in Group By.
Then open Profit (accepted).
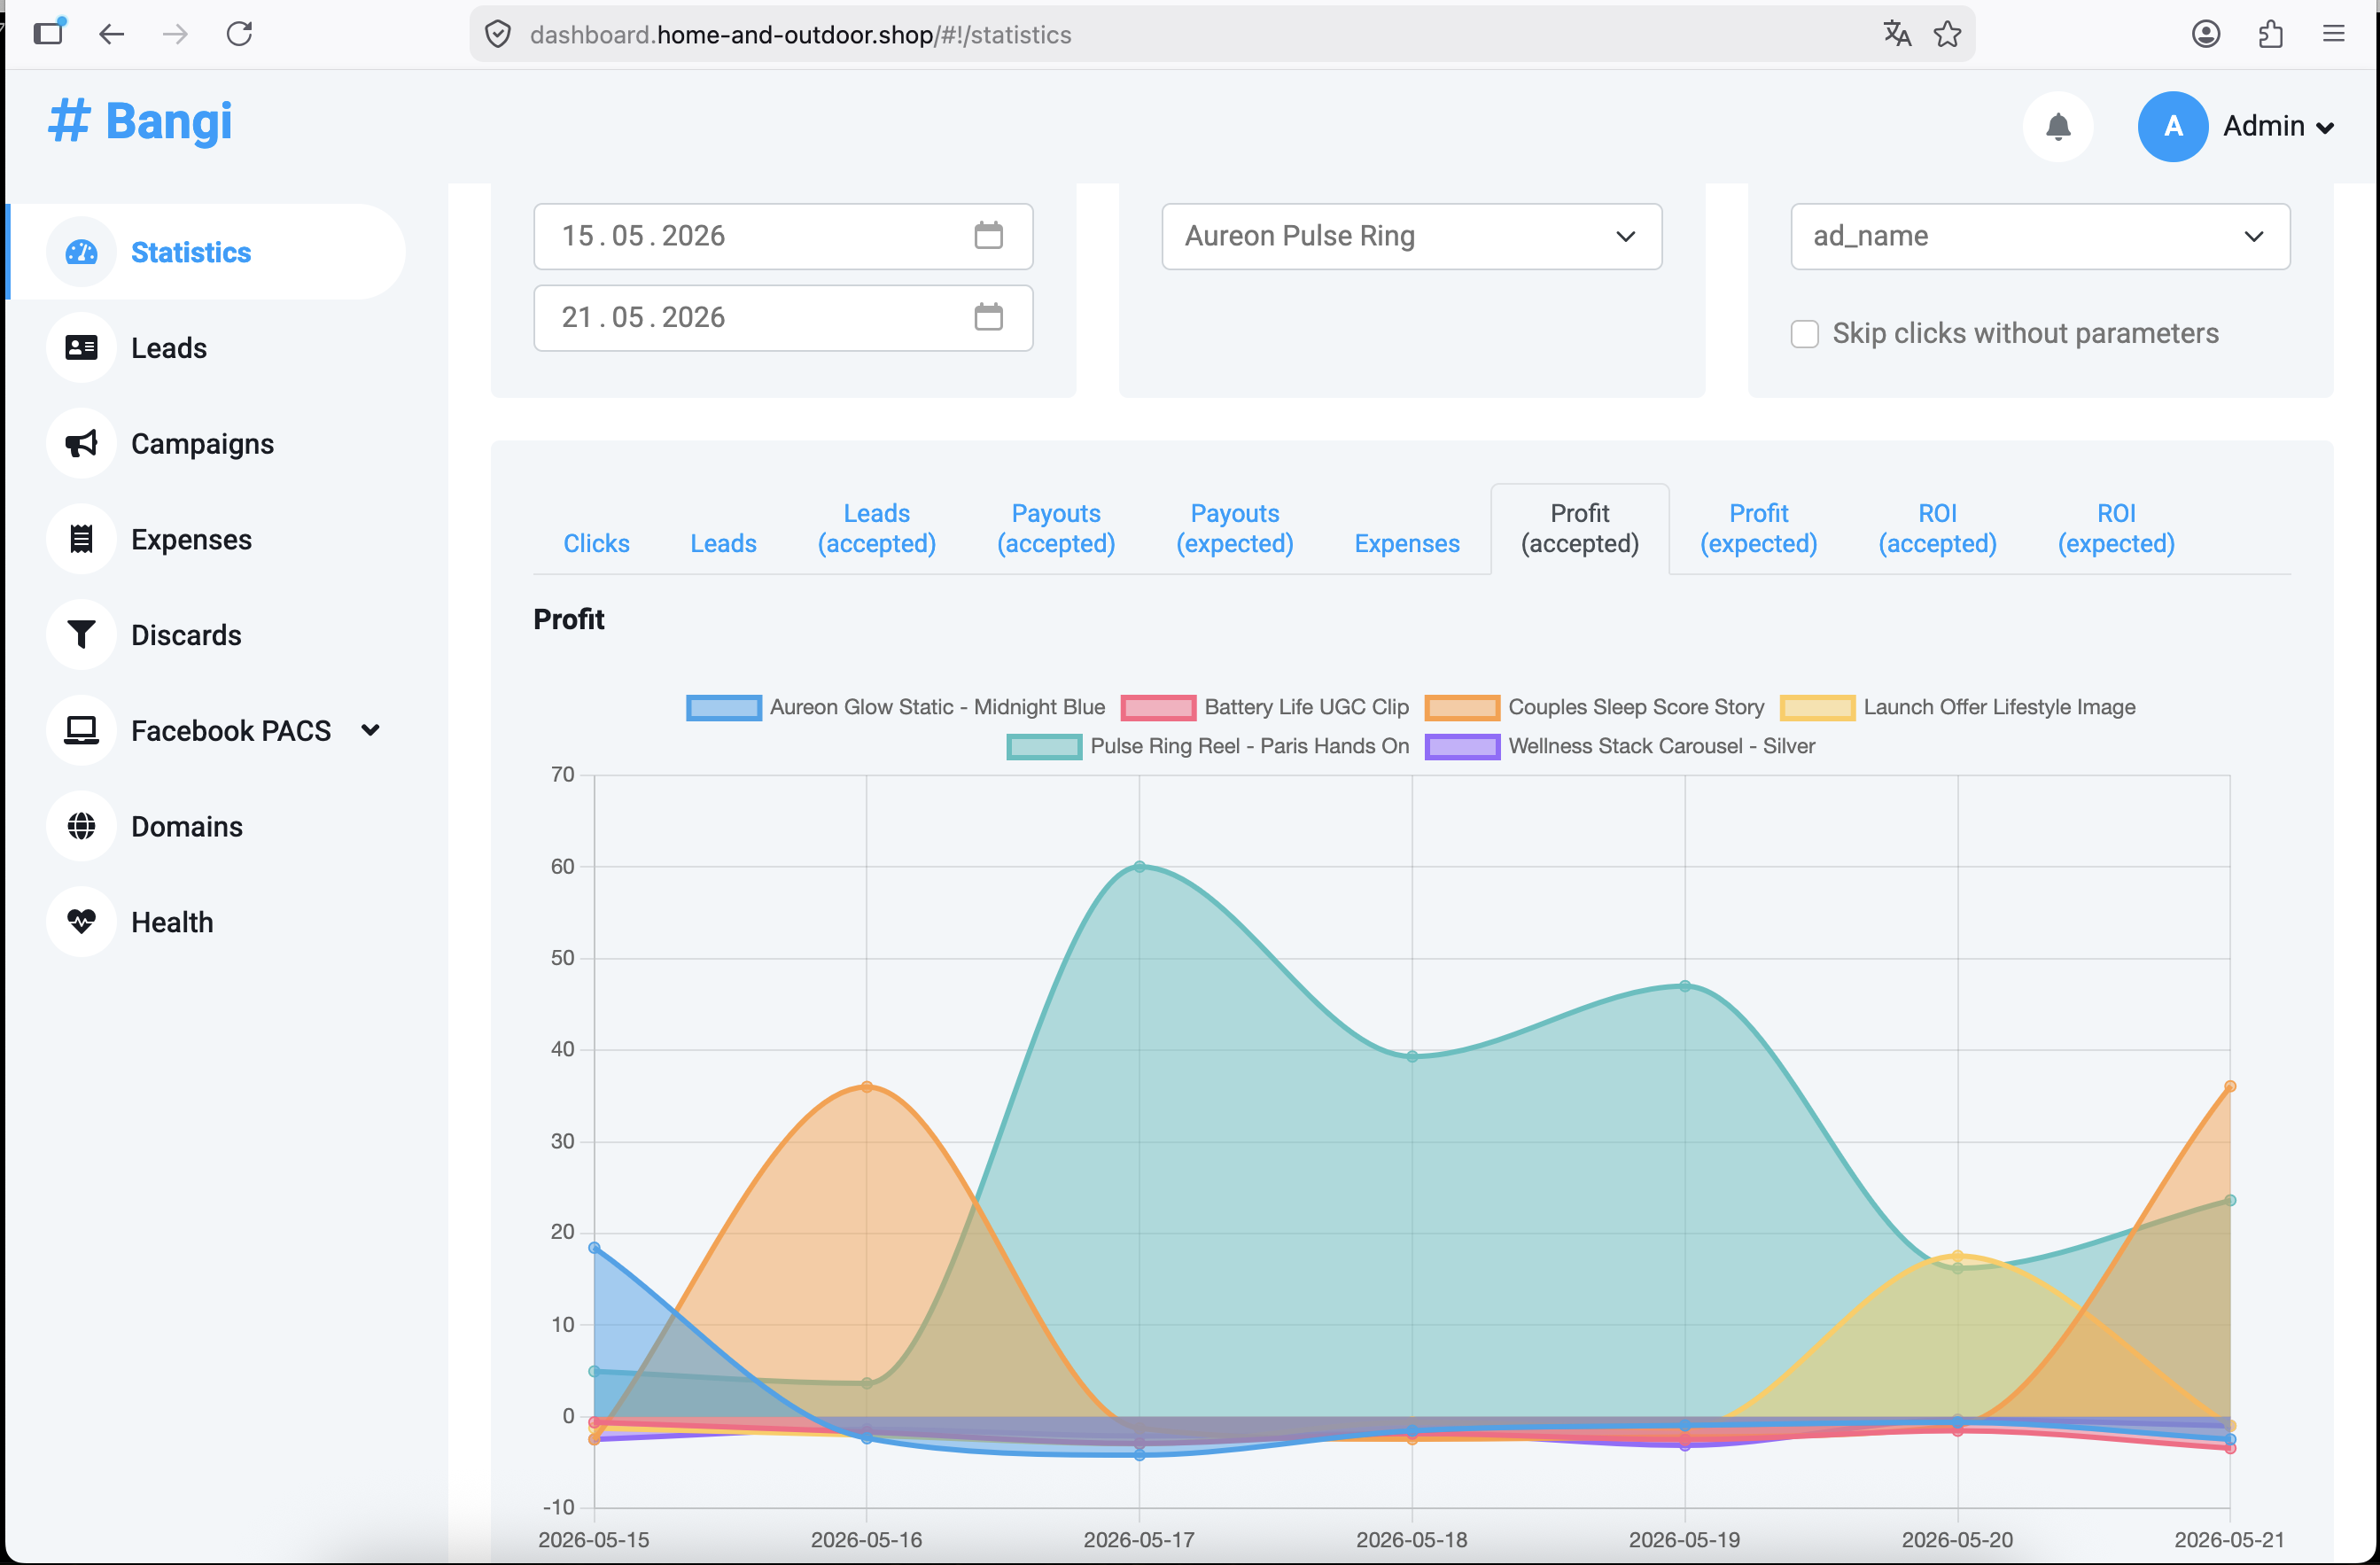
This view shows which ads generated approved profit after their assigned expenses.
In general:
- A line above zero means the segment is profitable for that day.
- A line near zero means revenue and cost are close.
- A line below zero means the segment spent more than it returned in accepted payout.
Use this view to identify ads that deserve more budget and ads that need to be paused, changed, or reviewed.
Step 9: Analyze ROI by Expense Distribution Parameter
Open ROI (accepted) while still grouping by the expense distribution parameter.
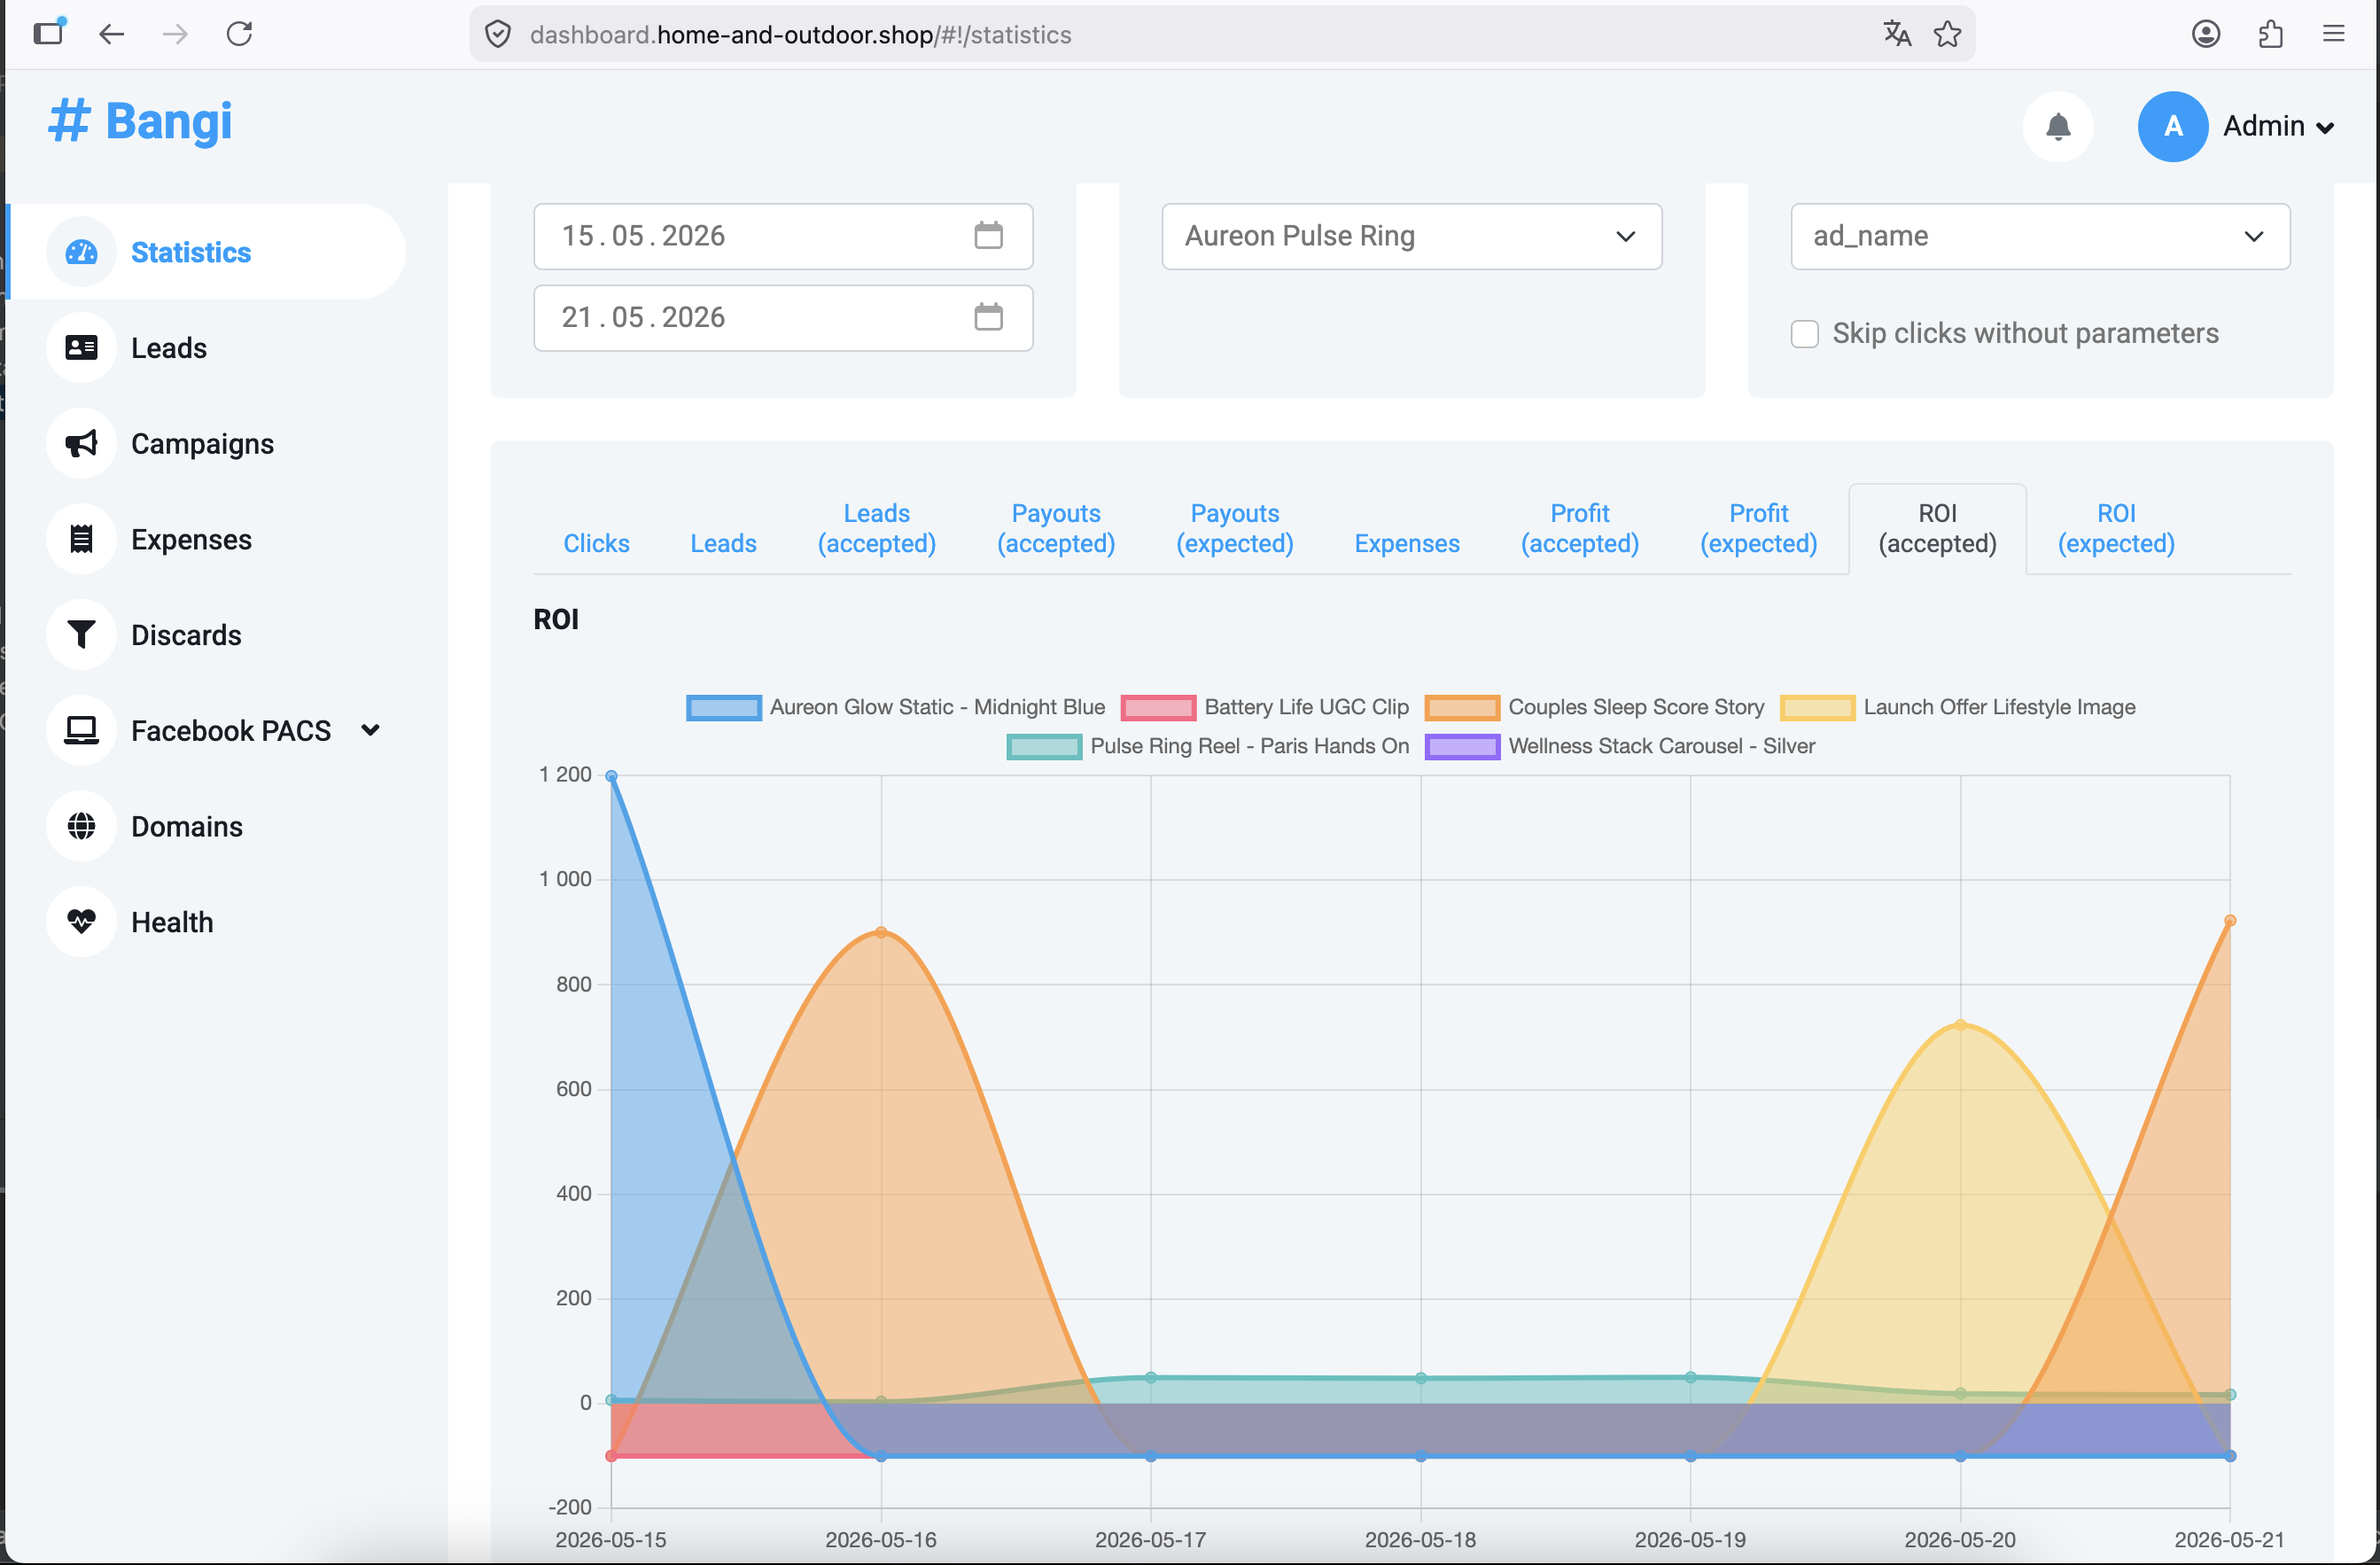
ROI shows return relative to cost. It helps compare segments even when they have different spend levels.
For example, one ad can have higher total profit because it spends more, while another ad can have better ROI because it earns more per unit of cost. Use profit and ROI together:
| Metric | Best for |
|---|---|
| Profit | Understanding absolute money gained or lost. |
| ROI | Comparing efficiency across segments with different costs. |
Step 10: Use Skip Clicks Without Parameters
Enable Skip clicks without parameters when you group by a parameter and want to exclude clicks that do not have that value.
For example, if you group by ad_name, some clicks may not include ad_name. When the checkbox is disabled, those clicks can still affect totals. When it is enabled, the report focuses only on clicks that include the selected grouping parameter.
Use this option when you are comparing named segments and want a cleaner view.
Troubleshooting
| Problem | Likely cause | Resolution |
|---|---|---|
| Report is empty | The campaign has no clicks in the selected date range, or the wrong campaign is selected | Confirm that the campaign has recorded traffic and expand the date range |
Group By has fewer parameters than expected |
Available parameters come from recorded click data | Select a date range with traffic that includes the missing parameter |
| A grouped report has an empty or unnamed segment | Some clicks do not contain the selected grouping parameter | Enable Skip clicks without parameters when you want to compare only clicks with that parameter |
| Profit or ROI is zero | Expenses are missing for the selected campaign and date range | Open Expenses and enter campaign costs for the same period |
| ROI looks too high or too low | Expenses are distributed by one parameter, but Statistics is grouped by another parameter | Group Statistics by the same parameter used in the Expenses report, such as ad_name |
| Accepted and expected values are different | Expected values include expected leads, while accepted values count approved leads only | Use accepted metrics for confirmed results and expected metrics for forecasting |